Crossbar Segmentation Analysis Graph – A Powerful Tool for Market Analysis
RJ0300077_25
- Last Update 05/10/2025
- File Size 1MB
- # of Slides 2
- File Format PPTX
- Slide Ratio 16:9
- Color
Keywords
- #Content-Based Slides
- #Design-Based Slides
- #Market and Competitor Analysis
- #Graph
- #Competitor Analysis
- #Market Analysis
- #Horizontal Bar
- #Segmented Horizontal Bar
- #16:9
- #horizontal stacked bar chart PowerPoint
- #segmented chart template
- #market analysis slide
- #data comparison graph
- #how to create stacked bar chart in PowerPoint
About the Product
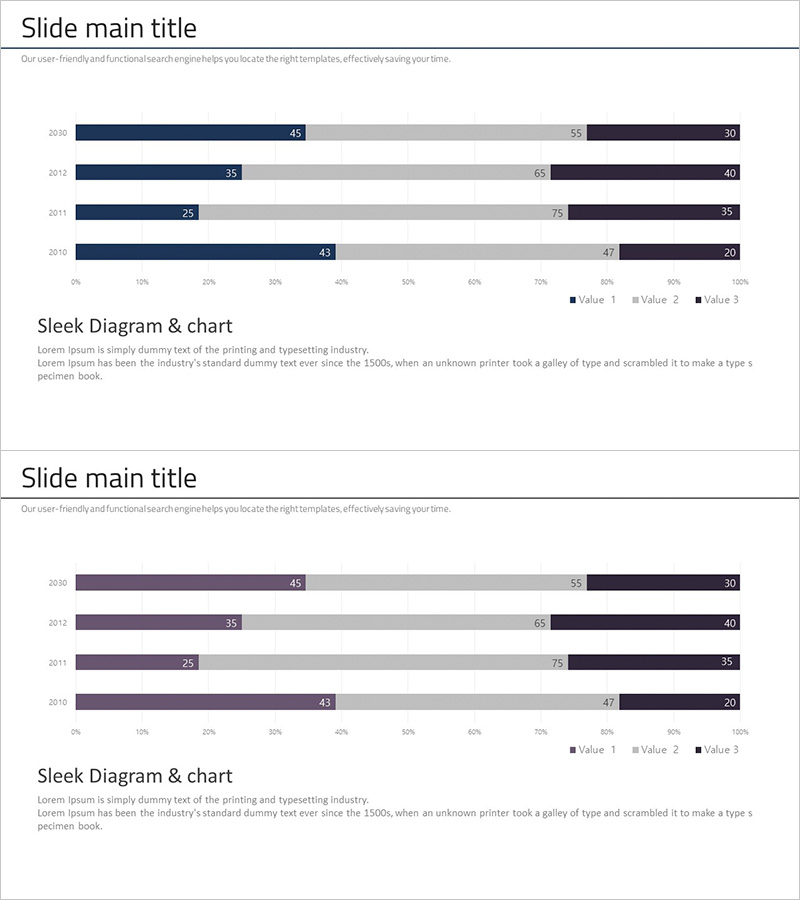
A horizontal stacked bar chart PowerPoint slide optimized for market analysis and competitive comparison. This 2-slide template visualizes 4 years (2010–2013) of data across 3 value series using a navy blue, gray, and black color scheme for clear differentiation. The horizontal bar layout ensures readability even with lengthy labels, and precise numerical annotations make it immediately applicable to presentations, reports, and business proposals. The stacked structure enables complex multi-dimensional data comparison, making it ideal for marketing strategy, sales analysis, and financial reporting.
Usage Points
-
Main Usage
Displays multi-year and multi-category data using horizontal stacked bars to intuitively compare market size, market share, and growth rates. The 3-series simultaneous display supports layered data interpretation essential for marketing, sales, and finance sections.
-
How to Use
Each year row contains 3 stacked bar segments that automatically update when values are entered. Customize colors, bar lengths, and labels to match your data, then insert into presentation slides, reports, or business plans for immediate use.
-
Recommended For
Marketing teams conducting market analysis and competitive benchmarking, sales teams comparing performance and regional results, finance teams analyzing quarterly and annual revenue structures, and executive reports requiring multi-indicator visualization.
-
Slide Structure
2-slide layout displaying 4 years (2010–2013) × 3 data series (Value 1, 2, 3) in horizontal stacked bar format. Navy blue, gray, and black distinguish each series, with 0–100% horizontal axis and precise numerical labels ensuring data accuracy.
Related Products
-

Space Industry Market Analysis Bar Graph – Providing Strategic Insights
#Market and Competitor Analysis #Graph #Competitor Analysis
-

VR Market Analysis Bar Graph – Understanding Competitive Landscape
#Market and Competitor Analysis #Graph #Competitor Analysis
-

Segmented Bar Graph for Market and Competitor Analysis
#Market and Competitor Analysis #Graph #Competitor Analysis
-

Horizontal Bar Graph Broken Down by Year – Optimal for Market and Competitor Analysis
#Market and Competitor Analysis #Graph #Competitor Analysis
