Successful Business Analysis Graph – Market and Competitor Analysis
RJ0300086_27
- Last Update 05/13/2025
- File Size 2.4MB
- # of Slides 2
- File Format PPTX
- Slide Ratio 16:9
- Color
Keywords
- #Content-Based Slides
- #Design-Based Slides
- #Market and Competitor Analysis
- #Graph
- #Competitor Analysis
- #Market Analysis
- #Column
- #Grouped Column
- #16:9
- #clustered bar chart PowerPoint
- #dual data comparison slide
- #business analysis graph template
- #competitor analysis PowerPoint
- #how to create clustered chart in PowerPoint
About the Product
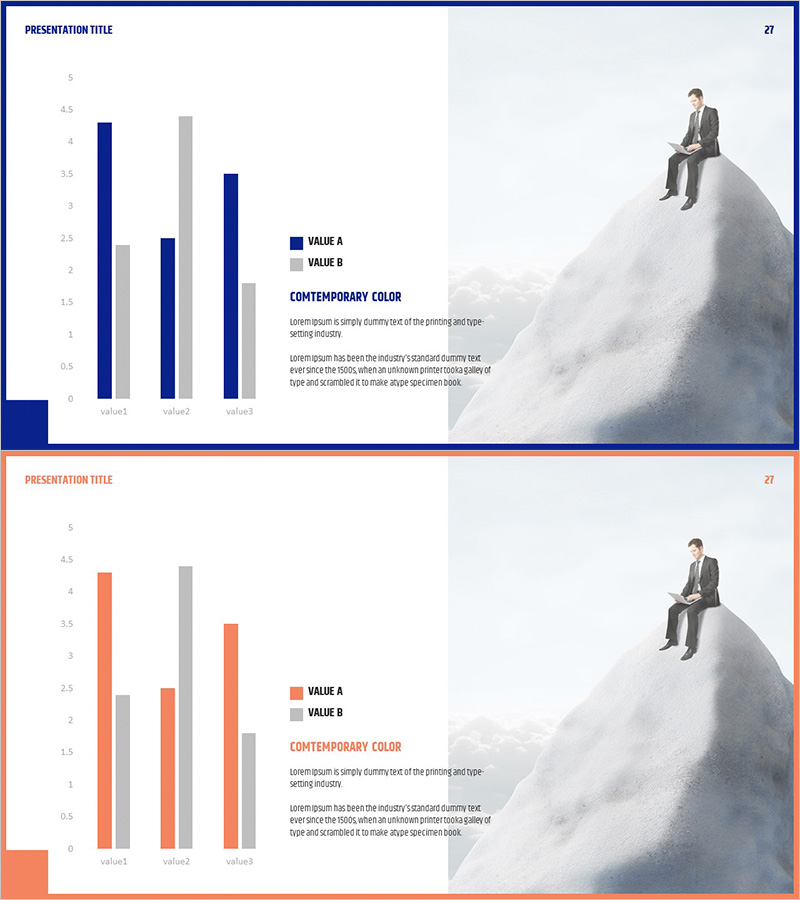
A professional clustered bar chart PowerPoint slide designed for business analysis and market research presentations. This slide template features both horizontal and vertical bar arrangements to compare two data series across three items simultaneously. The navy blue and gray color scheme clearly distinguishes VALUE A from VALUE B, enabling intuitive numerical comparison. Ideal for competitor analysis, market share comparison, performance metrics, and quarterly results presentations. Ready to download and edit for immediate use in business reports and strategic meetings.
Usage Points
-
Main Usage
The primary purpose is to compare two data series across three categories side by side. Commonly used for competitive benchmarking, market share analysis, performance tracking, and quarterly business reviews where relative numerical comparison is essential.
-
How to Use
Each item (VALUE1, VALUE2, VALUE3) displays paired bars in navy blue and gray, representing two different data groups. The right side of the slide includes space for supporting text and insights. Simply replace item names and numerical values to match your specific business context and industry data.
-
Recommended For
Executive reports, strategy meetings, investor presentations, consulting proposals, and data-driven decision-making sessions. Frequently used by marketing teams, sales departments, planning teams, and finance professionals who need to present quantitative analysis.
-
Slide Structure
Two-slide set with consistent layout: left side features a 3-item × 2-series clustered bar chart, right side contains image and text areas. Navy blue border frame and gray background provide visual unity. Slide number (27) and title area positioned at the top of each slide.
Related Products
-

Pill Market Analysis Vertical Bar Graph – Clear Visualization of Market Status
#Market and Competitor Analysis #Graph #Competitor Analysis
-

Market Competitor Analysis with Clustered Vertical Bar Chart
#Market and Competitor Analysis #Graph #Competitor Analysis
-

Earth Analysis Bundle Vertical Bar Graph – Market and Competitor Analysis
#Market and Competitor Analysis #Graph #Competitor Analysis
-

Comparative Analysis Vertical Chart – Market and Competitor Analysis
#Market and Competitor Analysis #Graph #Competitor Analysis
