Space Exploration Analysis Bar Graph
RJ0700010_24
- Last Update 07/24/2025
- File Size 0.5MB
- # of Slides 2
- File Format PPTX
- Slide Ratio 16:9
- Color
Keywords
- #Content-Based Slides
- #Design-Based Slides
- #Market and Competitor Analysis
- #Graph
- #Competitor Analysis
- #Market Analysis
- #Column
- #Grouped Column
- #16:9
- #grouped bar chart PowerPoint
- #2-series bar graph slide
- #horizontal vertical bar chart
- #data comparison chart template
- #market analysis PowerPoint slide
About the Product
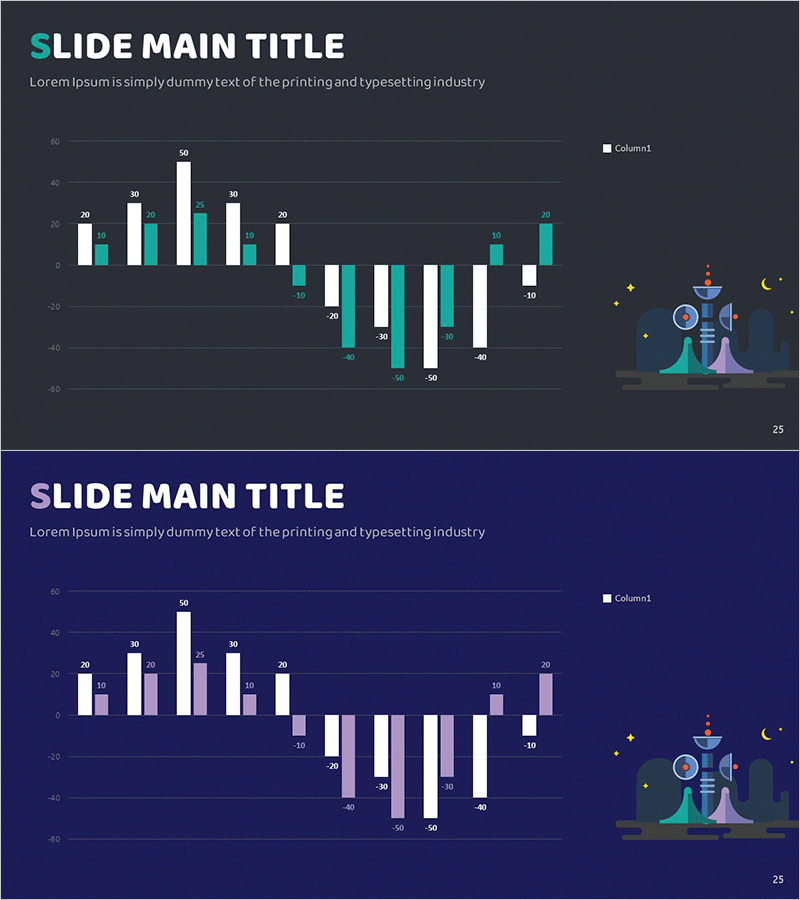
A 2-slide PowerPoint presentation featuring grouped bar charts for space exploration and market analysis data visualization. The charcoal background with cyan and white bar series enables clear numerical comparison across categories. The mixed horizontal and vertical layout adapts to various data structures, complete with legend and value labels for immediate use in presentations, reports, and proposals. Ideal for space exploration market analysis, competitive benchmarking, sales performance tracking, and any quantitative data communication requiring side-by-side comparison.
Usage Points
-
Main Usage
A grouped bar chart template comparing two or more data series side-by-side across categories. Effectively communicates space exploration market size, competitor sales figures, quarterly performance metrics, and other quantitative comparisons with intuitive visual hierarchy and flexible horizontal/vertical orientation.
-
How to Use
Insert into business plans, market analysis reports, quarterly earnings presentations, and competitive analysis documents to emphasize numerical comparisons. Leverage the legend and value labels to guide audience understanding of precise figures, and customize colors to match brand guidelines for cohesive visual identity.
-
Recommended For
Marketing professionals, business analysts, strategists, and executives presenting market size, sales performance, customer satisfaction metrics, and competitive positioning. Particularly valuable in space exploration, IT, finance, manufacturing, and data-driven industries requiring quantitative decision-making support.
-
Slide Structure
2-slide set. Slide 1 features horizontal grouped bar chart (approximately 10 categories, 2 series) on charcoal background. Slide 2 presents vertical grouped bar chart (approximately 10 categories, 2 series) with identical data for multi-perspective analysis. Illustration elements (space probe, analysis icons) positioned on right side for visual balance.
Related Products
-

Watercolor Competitor Analysis Vertical Bar Chart – Market Insights
#Market and Competitor Analysis #Graph #Competitor Analysis
-

Business Plan Competitor Analysis Chart – Effective Market Analysis Tool
#Market and Competitor Analysis #Diagram #Graph
-

Vertical Bar Cluster Analysis Graph – Market and Competitor Analysis
#Market and Competitor Analysis #Graph #Competitor Analysis
-

Comparative Analysis Vertical Chart – Market and Competitor Analysis
#Market and Competitor Analysis #Graph #Competitor Analysis
