Sensuous Doughnut Chart Slide – Market Share Analysis
RJ0200039_12
- Last Update 04/09/2025
- File Size 0.2MB
- # of Slides 2
- File Format PPTX
- Slide Ratio 16:9
- Color
Keywords
- #Content-Based Slides
- #Design-Based Slides
- #Market and Competitor Analysis
- #Diagram
- #Graph
- #Market Share
- #Competitive Advantage
- #Table
- #Circles
- #Standard Table
- #Doughnut Chart
- #16:9
- #doughnut chart PowerPoint
- #pie chart slide template
- #ratio analysis presentation
- #market share chart
- #donut graph slide design
About the Product
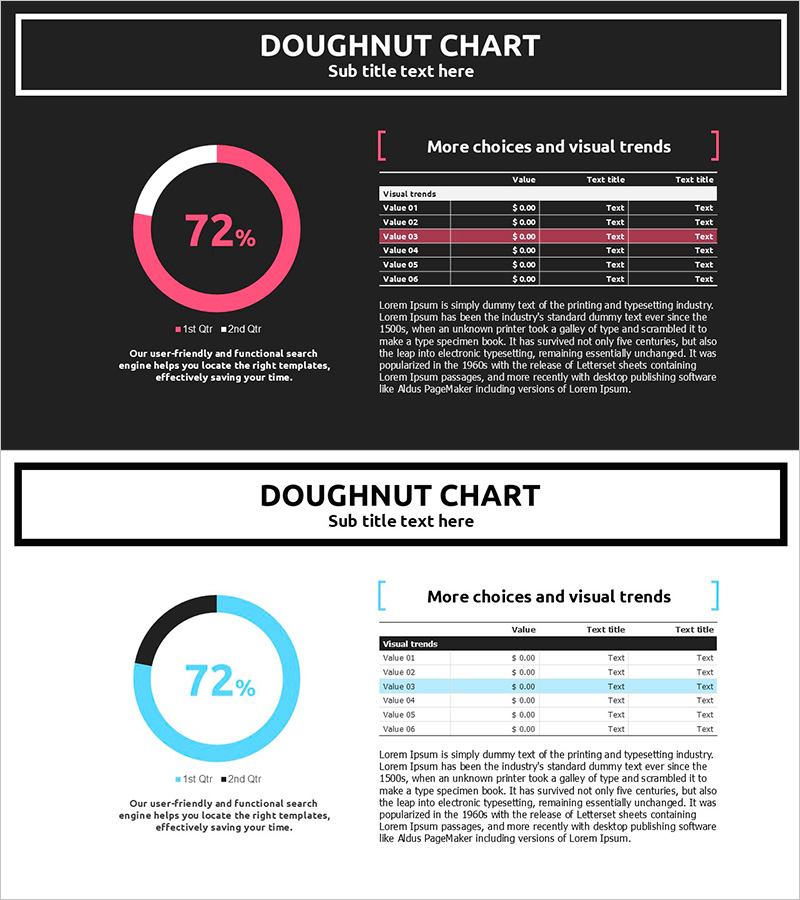
A doughnut chart PowerPoint slide featuring a dark background with pink and blue dual-tone color schemes. The layout emphasizes a 72% metric in the center, making it ideal for visualizing market share, customer satisfaction, goal achievement rates, and other ratio-based data. A legend and detailed data table are positioned on the right side for immediate presentation use. The 2-slide set includes color variations (pink and blue), formatted in 16:9 widescreen PPTX for full compatibility with all PowerPoint versions and easy editing.
Usage Points
-
Main Usage
Visualizes ratio-based data such as market share, customer satisfaction, goal achievement, and budget allocation through a circular chart format. The centered metric highlight ensures key figures are instantly recognizable, while the accompanying data table provides detailed numerical context.
-
How to Use
Apply this slide in executive reports, business plan presentations, marketing analysis decks, and financial reports when explaining ratio-driven data. Edit the chart values and legend directly in the slide master to instantly adapt the template to your specific data.
-
Recommended For
Ideal for executives, marketing managers, financial analysts, consultants, and sales leaders who need to communicate data-driven insights. Particularly effective for quarterly performance reports, market analysis presentations, and competitive benchmarking discussions.
-
Slide Structure
Slide 1: Dark background with pink-toned doughnut chart (72% metric centered) + right-aligned legend and 6-row data table + descriptive text footer. Slide 2: Identical layout with blue-tone color variation. 16:9 widescreen format, fully editable PPTX.
Related Products
-

Market Share and Competitive Advantage via Bar and Donut Charts – Product Satisfaction Survey
#Market and Competitor Analysis #Graph #Market Share
-

Visualization of War Equipment Penetration Rate – Market Share Analysis
#Market and Competitor Analysis #Graph #Market Share
-

Type Comparison Analysis Graph & Table – Effective Tool for Market Analysis
#Market and Competitor Analysis #Diagram #Graph
-

Travel Agency Market Share and Trends – Data Slide for Competitive Advantage
#Market and Competitor Analysis #Diagram #Graph
