Market Analysis and Competitive Advantage Graph – The Power of Data Visualization
RJ0400010_15
- Last Update 05/19/2025
- File Size 0.2MB
- # of Slides 2
- File Format PPTX
- Slide Ratio 16:9
- Color
Keywords
- #Content-Based Slides
- #Design-Based Slides
- #Market and Competitor Analysis
- #Graph
- #Market Analysis
- #Competitive Advantage
- #Circles
- #Doughnut Chart
- #16:9
- #donut chart PowerPoint slide
- #pie chart template
- #market analysis visualization
- #4-segment donut diagram
- #data visualization slide
- #comparison chart template
About the Product
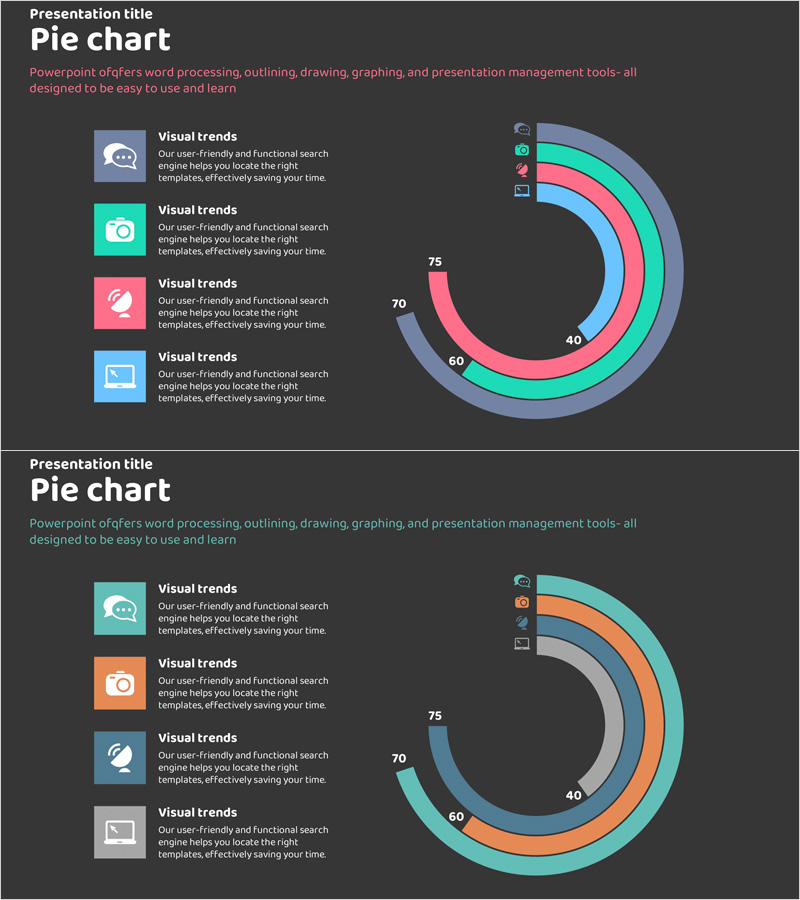
A professional donut chart PowerPoint slide designed to visualize market analysis and competitive advantage across four key segments. Set against a dark gray background, the concentric donut chart features four distinct colors—pink, mint, blue, and purple—representing hierarchical data layers. The left side displays four icons with corresponding text descriptions, while the right side shows the donut chart with labeled data points (40, 60, 70, 75). This two-slide template is ready to use in business presentations, quarterly reports, and strategic planning decks. Fully editable in PowerPoint format.
Usage Points
-
Main Usage
Visualize four-way comparisons such as market segments, competitive advantages, departmental performance, or customer categories. The concentric donut structure clearly shows part-to-whole relationships and proportional data distribution, with numeric labels ensuring precise data communication.
-
How to Use
Edit the four icons and text labels on the left to match your categories and descriptions. Customize the donut chart colors and numeric values to reflect your actual data. The dark gray background enhances the visual impact of the colored segments, making it suitable for projector presentations, virtual meetings, and printed materials.
-
Recommended For
Marketing teams presenting market analysis, executive business reports, strategic planning documents, quarterly performance reviews, customer segmentation strategies, and product positioning materials. Ideal for marketing, management, and sales professionals who need to compare four key metrics or segments.
-
Slide Structure
Two-slide template with consistent layout: left side features four icon-text pairs (chat, camera, pen, screen) for category labels; right side displays a four-segment donut chart in pink, mint, blue, and purple with centered numeric labels (40, 60, 70, 75). 16:9 widescreen format optimized for modern projectors and displays.
Related Products
-

Market Competitive Advantage Analysis with Donut Graph
#Market and Competitor Analysis #Diagram #Graph
-

Drug Addiction Risk Analysis Graph Chart – Insightful Information Delivery
#Market and Competitor Analysis #Diagram #Graph
-

Stock Price Rise Analysis Donut Graph – Market Growth and Opportunities
#Market and Competitor Analysis #Diagram #Graph
-

Type Comparison Analysis Graph & Table – Effective Tool for Market Analysis
#Market and Competitor Analysis #Diagram #Graph
