Trade Business Analysis Bar Chart - Insights on Competitors and Markets
RJ0300062_27
- Last Update 05/05/2025
- File Size 2.6MB
- # of Slides 2
- File Format PPTX
- Slide Ratio 16:9
- Color
Keywords
- #Content-Based Slides
- #Design-Based Slides
- #Market and Competitor Analysis
- #Graph
- #Competitor Analysis
- #Market Analysis
- #Horizontal Bar
- #Horizontal Bar Chart
- #16:9
- #horizontal bar chart PowerPoint
- #competitor analysis slide
- #market comparison chart
- #trade business analysis PPT
- #bar graph presentation template
About the Product
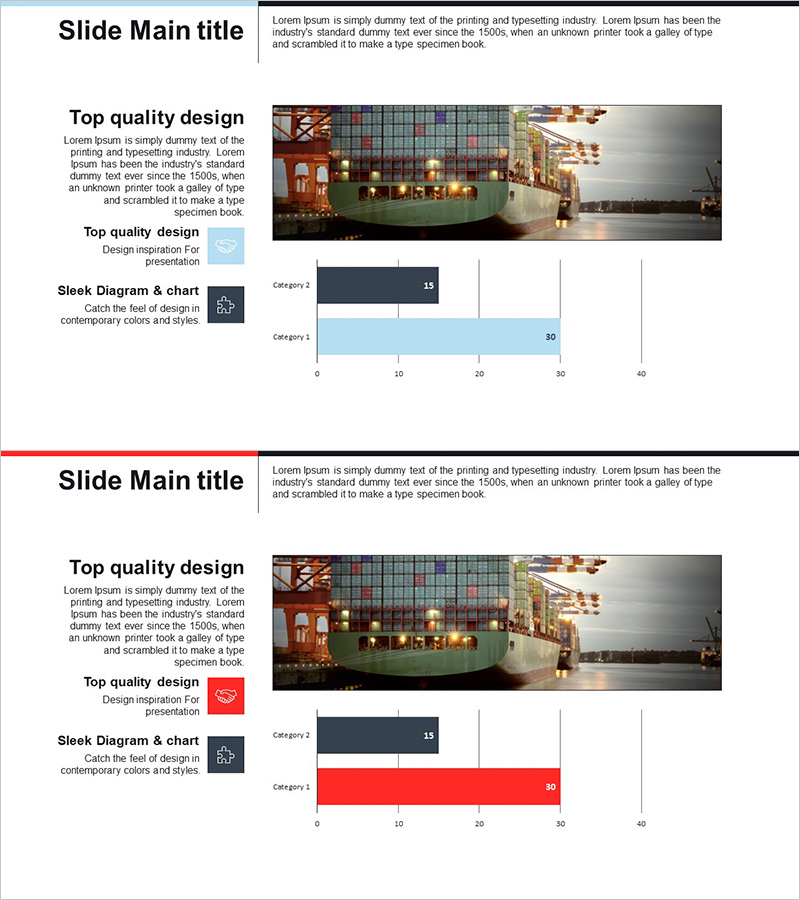
A horizontal bar chart PowerPoint slide optimized for trade business analysis and competitive market insights. This presentation template features light blue and dark navy color schemes to clearly visualize competitor performance metrics and market positioning data. Delivered in 2-slide 16:9 widescreen format, each slide includes horizontal bar charts for category-by-category numerical comparison and descriptive text areas. Ideal for business reports, strategy presentations, and investor pitches where competitive landscape and market share need to be communicated effectively.
Usage Points
-
Main Usage
Used in trade and business contexts to compare competitor performance indicators and market share through data-driven visualization. The horizontal bar layout arranges multiple data points side-by-side for intuitive relative size comparison, making it suitable for executive reports, investor presentations, and marketing strategy briefings.
-
How to Use
Replace bar lengths and numerical values with actual data, and update category labels (Category 1, 2) to competitor names or market segments. Retain the light blue and dark navy color scheme or customize to match corporate brand colors. Add analysis insights and commentary in the text areas to complete the presentation.
-
Recommended For
Trade company professionals, market analysts, executives and senior management, marketing and strategy planning teams, investor relations specialists, and business consultants presenting competitive landscape analysis and market positioning.
-
Slide Structure
2-slide layout with horizontal bar charts on each slide. Two categories (Category 1 and 2) are displayed with light blue bars (30 value) and dark navy bars (15 value) positioned side-by-side for easy numerical comparison. Title and descriptive text areas at the top allow for contextual analysis information.
Related Products
-

Mobile SNS Market Analysis Graph – Visualizing Competitor Analysis Data
#Market and Competitor Analysis #Diagram #Graph
-

Cement Theme Bar Graph & Table
#Market and Competitor Analysis #Diagram #Graph
-

Pencil Bar Chart for Market Analysis – Visual Competitiveness
#Market and Competitor Analysis #Graph #Other
-

Competitor Comparison and Market Analysis Chart
#Market and Competitor Analysis #Graph #Competitor Analysis
