Competitor Growth Comparison Chart – Essential Slide for Market Analysis
RM0400011_10
- Last Update 02/17/2025
- File Size 0.6MB
- # of Slides 2
- File Format PPTX
- Slide Ratio 16:9
- Color
Keywords
- #Content-Based Slides
- #Design-Based Slides
- #Market and Competitor Analysis
- #Graph
- #Competitor Analysis
- #Market Analysis
- #Horizontal Bar
- #Horizontal Bar Chart
- #16:9
- #competitor comparison chart
- #horizontal bar graph PowerPoint
- #market analysis slide template
- #competitive analysis chart
- #growth comparison presentation
About the Product
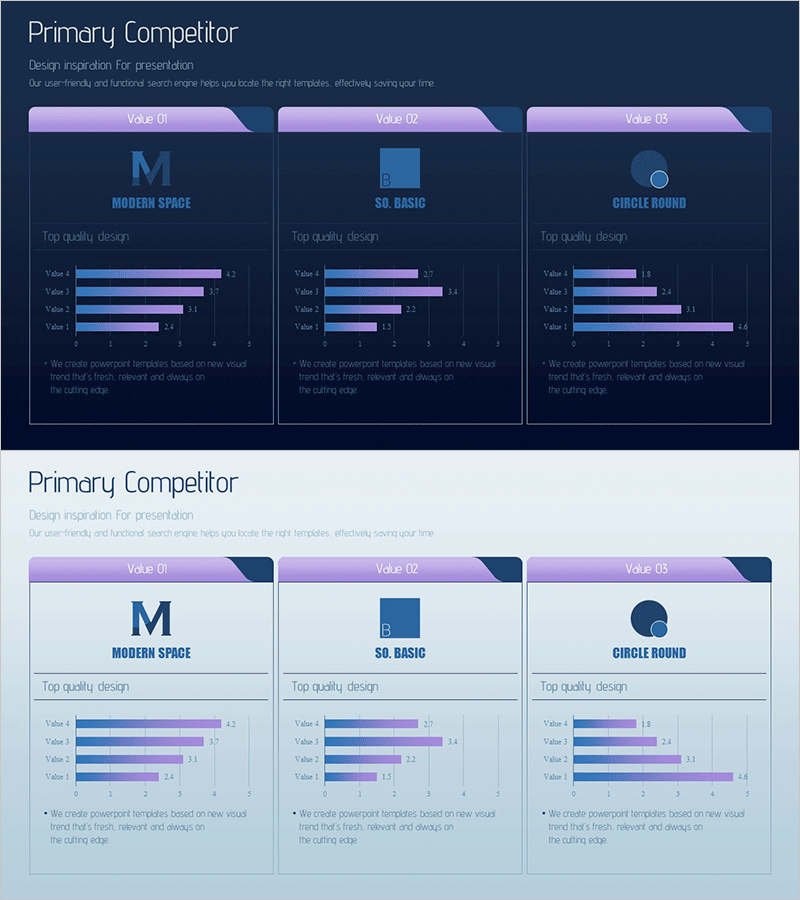
A horizontal bar chart PowerPoint slide optimized for market analysis and competitive comparison. Designed with a dark navy background and purple-to-blue gradient bars, it enables clear comparison of growth metrics across four competitors at a glance. Each item displays precise numerical labels for immediate presentation use, with a 2-slide structure accommodating multiple data scenarios. This PPT chart template is ideal for investor pitch decks, executive reports, marketing strategy presentations, and business proposals where competitive positioning must be communicated with impact and clarity.
Usage Points
-
Main Usage
Compares quantitative metrics—such as competitor growth rates, market share, or revenue scale—across four items using a horizontal bar chart. The dark navy background with purple-to-blue gradient bars visually emphasizes competitive positioning, while clear numerical labels on each bar enable precise data communication during presentations.
-
How to Use
Deploy this slide in investor pitch decks, executive reports, marketing strategy presentations, and business plans when presenting market analysis and competitive landscape. The bar length and color gradient intuitively convey relative performance, while numerical labels support accurate data comparison and stakeholder confidence.
-
Recommended For
Executives, investors, marketing managers, and strategic planning teams presenting competitive analysis findings. Particularly effective for startup investor relations, quarterly business reviews, and new market entry strategy presentations where credible competitive data visualization is essential.
-
Slide Structure
Two-slide layout: the first features a dark navy background with four purple-to-blue gradient horizontal bars; the second uses a light gray background with the same bar structure. Numerical labels (ranging 1.2–4.0) appear to the right of each bar, and a header with 'Value 01·02·03' tab-style category divisions allows flexible application of multiple data sets.
Related Products
-

Cement Theme Bar Graph & Table
#Market and Competitor Analysis #Diagram #Graph
-

Competitor Comparison and Market Analysis Chart
#Market and Competitor Analysis #Graph #Competitor Analysis
-

Sugar Content Analysis Bar Graph Table
#Market and Competitor Analysis #Diagram #Graph
-

Mobile SNS Market Analysis Graph – Visualizing Competitor Analysis Data
#Market and Competitor Analysis #Diagram #Graph
