Red Blue Area Chart – Market and Competitor Analysis
RJ0300027_32
- Last Update 04/25/2025
- File Size 0.4MB
- # of Slides 2
- File Format PPTX
- Slide Ratio 16:9
- Color
Keywords
- #Content-Based Slides
- #Design-Based Slides
- #Market and Competitor Analysis
- #Graph
- #Competitor Analysis
- #Competitive Advantage
- #Horizontal Bar
- #Horizontal Bar Chart
- #16:9
- #area chart PowerPoint
- #area graph slide template
- #2-series chart design
- #market analysis presentation
- #competitor comparison chart
- #trend visualization PowerPoint
About the Product
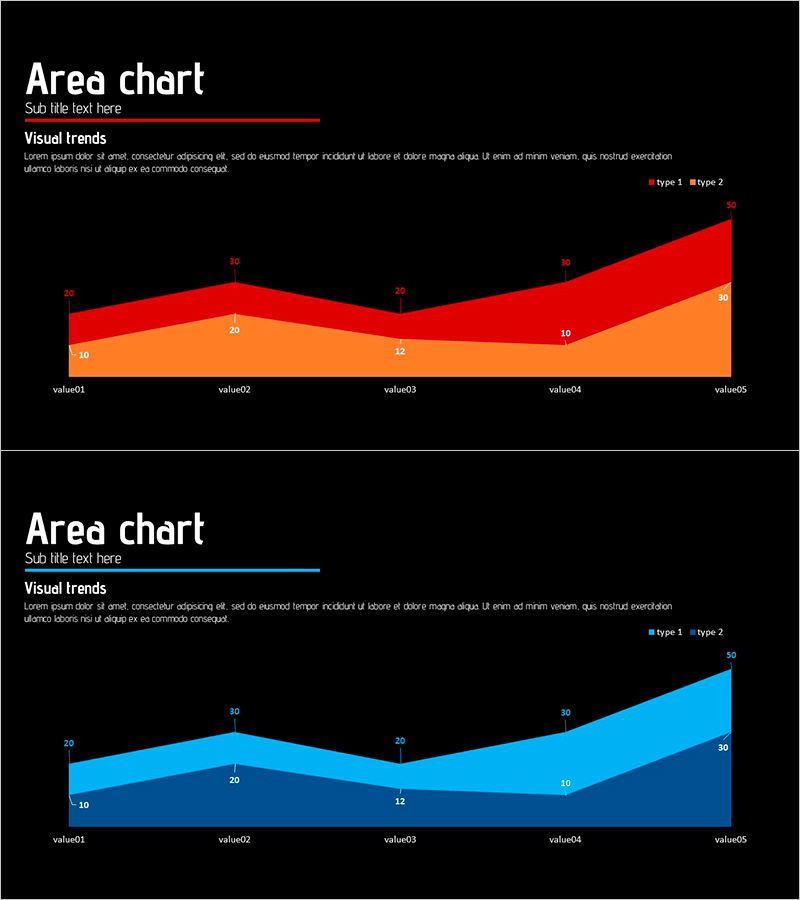
An area chart PowerPoint slide optimized for market analysis and competitor comparison presentations. This template visualizes trend changes across five data points using two distinct area series in red and blue, with numerical labels displayed at each value for precise data interpretation. The high-contrast color scheme against a black background maximizes presentation impact, while the 16:9 widescreen format with 2-slide layout enables immediate use. Perfect for business reports, competitive analysis, market share evolution, and performance benchmarking across various industries and departments.
Usage Points
-
Main Usage
Displays two data series as stacked or overlapping area graphs to simultaneously show trend progression over time and comparative relationships between series. Ideal for visualizing market size evolution, competitive performance metrics, revenue trends, and other quantitative data requiring dual-series analysis.
-
How to Use
Enter your analysis topic in the slide title area (e.g., Market Size Trends, Competitive Landscape Changes). Modify chart legend and axis labels to match your data, then update values by double-clicking the chart. Series colors and transparency can be adjusted as needed, and data points update in real-time.
-
Recommended For
Strategic planning, marketing, sales, and finance teams presenting executive reports, quarterly performance reviews, market research findings, and competitive intelligence. Particularly effective when comparing two or more key performance indicators or market metrics.
-
Slide Structure
2-slide layout: Slide 1 features a red-orange 2-series area chart with 5 data points and value labels; Slide 2 displays a blue-navy 2-series area chart with identical structure. Each slide includes title, subtitle, legend, and X-axis labels (value01 through value05).
Related Products
-

Triangle Pattern Wide PowerPoint Template – Horizontal Bar Chart
#Market and Competitor Analysis #Graph #Competitor Analysis
-

Navy Orange Comparison Bar Graph
#Market and Competitor Analysis #Graph #Competitor Analysis
-

Ticket Sales Graph – Visualizing Competitive Edge
#Market and Competitor Analysis #Graph #Competitor Analysis
-

Horizontal Bar Chart for Competitive Advantage Analysis – Sea Lighthouse
#Market and Competitor Analysis #Diagram #Graph
