Mobile SNS Market Analysis Graph – Visualizing Competitor Analysis Data
RJ0400062_20
- Last Update 06/04/2025
- File Size 0.2MB
- # of Slides 2
- File Format PPTX
- Slide Ratio 16:9
- Color
Keywords
- #Content-Based Slides
- #Design-Based Slides
- #Market and Competitor Analysis
- #Diagram
- #Graph
- #Competitor Analysis
- #Market Analysis
- #Cluster
- #Horizontal Bar
- #Closed Cluster Diagram
- #Horizontal Bar Chart
- #16:9
- #horizontal bar chart PowerPoint
- #competitor analysis slide
- #market analysis template
- #data visualization PPT
- #how to create bar chart in PowerPoint
About the Product
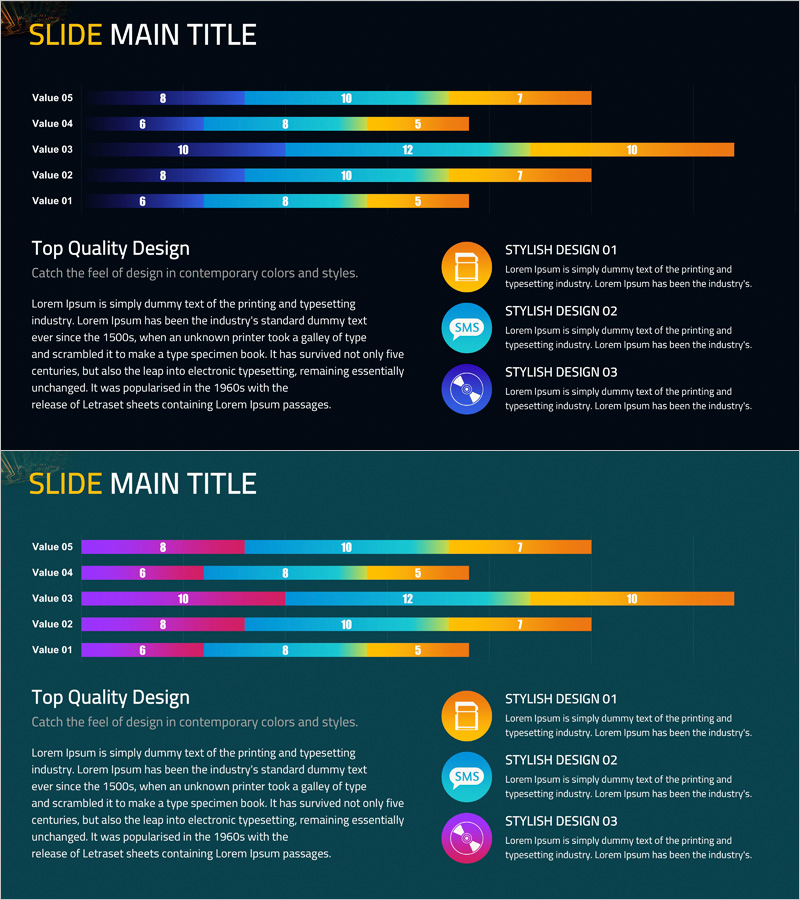
A horizontal bar chart PowerPoint slide optimized for mobile SNS market analysis and competitive benchmarking. Dark background with blue-to-orange gradient bars clearly represent numerical data across five categories. Each bar is segmented with distinct color zones to visualize complex multi-series data intuitively. Perfect for marketing plans, business reports, and investor presentations to illustrate market share, competitive intensity, and performance metrics. Two-slide 16:9 widescreen set ready for immediate editing and deployment.
Usage Points
-
Main Usage
Compare competitor performance, market share, and key metrics within the mobile SNS landscape using data-driven visualization. The horizontal bar layout makes item labels and values easy to read simultaneously, enhancing audience comprehension and decision-making confidence.
-
How to Use
Replace bar values with actual dataset figures and adjust legend colors by organization or competitor. During presentation, emphasize ranking, gaps, and trends through bar length comparison. Add supporting text in adjacent areas to reinforce insights and strategic implications.
-
Recommended For
Ideal for marketing professionals, strategy teams, and executive reporting. Particularly effective for market research findings, competitive analysis, performance benchmarking, budget allocation, and any presentation requiring quantitative data to drive business decisions.
-
Slide Structure
Two-slide set: First slide features dark navy background with five horizontal bars (blue-to-orange gradient) stacked vertically, numerical values displayed at bar ends. Second slide offers alternative color arrangement for diverse dataset representation. 16:9 widescreen format with fully editable elements including bars, labels, values, and background.
Related Products
-

Business Area Analysis Graph – Suitable for Market and Competitive Analysis
#Market and Competitor Analysis #Diagram #Graph
-

Competitive Hotel Service Comparison Analysis Diagram
#Market and Competitor Analysis #Graph #Competitor Analysis
-

Gradient Bar Graph Presentation – Market Competitiveness Analysis
#Market and Competitor Analysis #Graph #Competitor Analysis
-

Business Plan Competitor Analysis Chart – Effective Market Analysis Tool
#Market and Competitor Analysis #Diagram #Graph
