Target Market Strategy Diagram & Bar Graph
RJ0400037_19
- Last Update 05/27/2025
- File Size 5.6MB
- # of Slides 2
- File Format PPTX
- Slide Ratio 16:9
- Color
Keywords
- #Content-Based Slides
- #Design-Based Slides
- #Market and Competitor Analysis
- #Marketing Plan and Strategy
- #Diagram
- #Graph
- #Market Analysis
- #Target Market Strategy
- #Flow
- #Column
- #Linear Flow
- #Column Chart
- #16:9
- #linear diagram PowerPoint
- #3-step process slide
- #bar graph template
- #market strategy diagram
- #comparison analysis PPT slide
About the Product
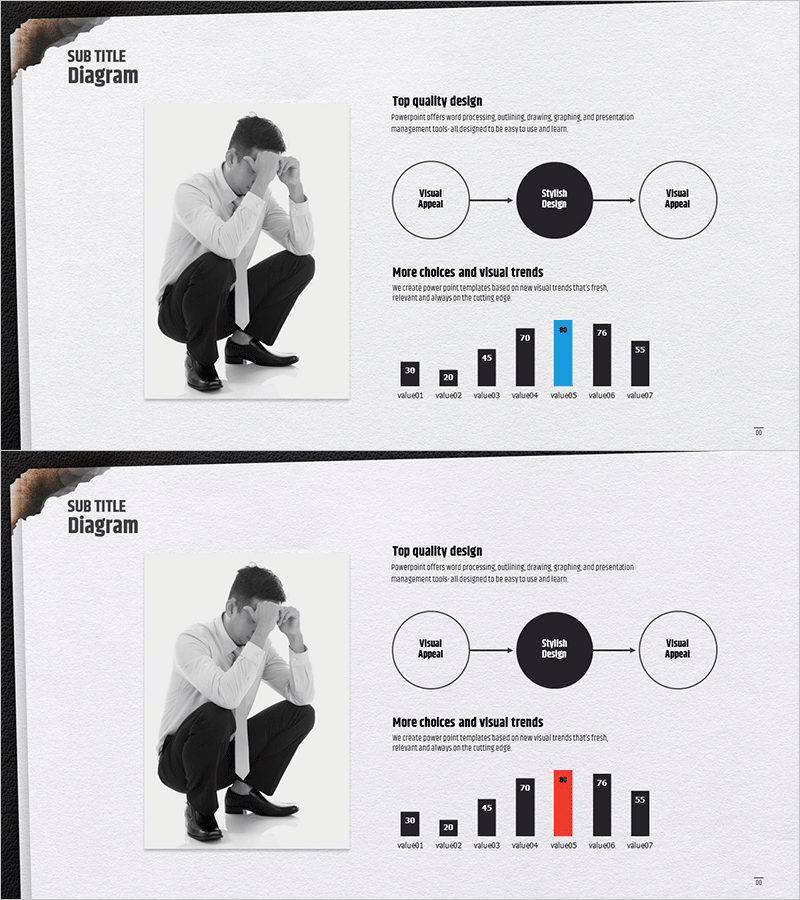
A 2-slide PowerPoint presentation that visualizes target market strategy with precision. The first slide features a 3-step linear diagram connecting visual appeal, stylish design, and visual appeal through circular nodes, with the center node highlighted in black and outer nodes in white. The second slide displays a 7-item bar graph for clear numerical comparison, with one bar emphasized in blue to highlight key data. Delivered in 16:9 widescreen PPTX format, fully editable and ready for business presentations, strategic planning, and competitive analysis reports.
Usage Points
-
Main Usage
Simultaneously present the step-by-step process of target market strategy and competitive numerical data. The linear diagram clarifies strategic flow while the bar graph provides quantitative evidence, creating a persuasive presentation that combines conceptual and analytical perspectives.
-
How to Use
Enter strategy phase names into the 3 nodes on the first slide, then replace the bar graph data with actual figures on the second slide. Customize the center node's black color and the emphasis bar's blue color to match your company brand palette for a cohesive presentation.
-
Recommended For
Marketing managers, strategic planning teams, and sales executives presenting market entry plans, competitive analysis, and performance comparisons. Ideal for startup investment pitches, quarterly strategy reports in large corporations, and client proposals from consulting firms.
-
Slide Structure
Slide 1: Three circular nodes (left, center, right) connected by arrows in linear flow. Center node features black background with white text; outer nodes have white background with black text for contrast. Slide 2: Vertical bar graph displaying 7 items (value1 through value7), with the 5th bar highlighted in blue and remaining bars in black-series tones.
Related Products
-

Origami Presentation Template Map – Visualize Market Analysis
#Market and Competitor Analysis #Graph #Other
-

Market Analysis Template with Pyramid Diagram - Rainbow Color Scheme
#Market and Competitor Analysis #Marketing Plan and Strategy #Diagram
-

Automobile Market Export Volume Visualization Slide – Market Analysis and Strategy
#Market and Competitor Analysis #Marketing Plan and Strategy #Diagram
-

Future Outlook Analysis Bar Graph – Essential for Market Analysis
#Market and Competitor Analysis #Graph #Future Outlook
