Origami Presentation Template Map – Visualize Market Analysis
RJ0200041_15
- Last Update 04/09/2025
- File Size 0.6MB
- # of Slides 2
- File Format PPTX
- Slide Ratio 16:9
- Color
Keywords
About the Product
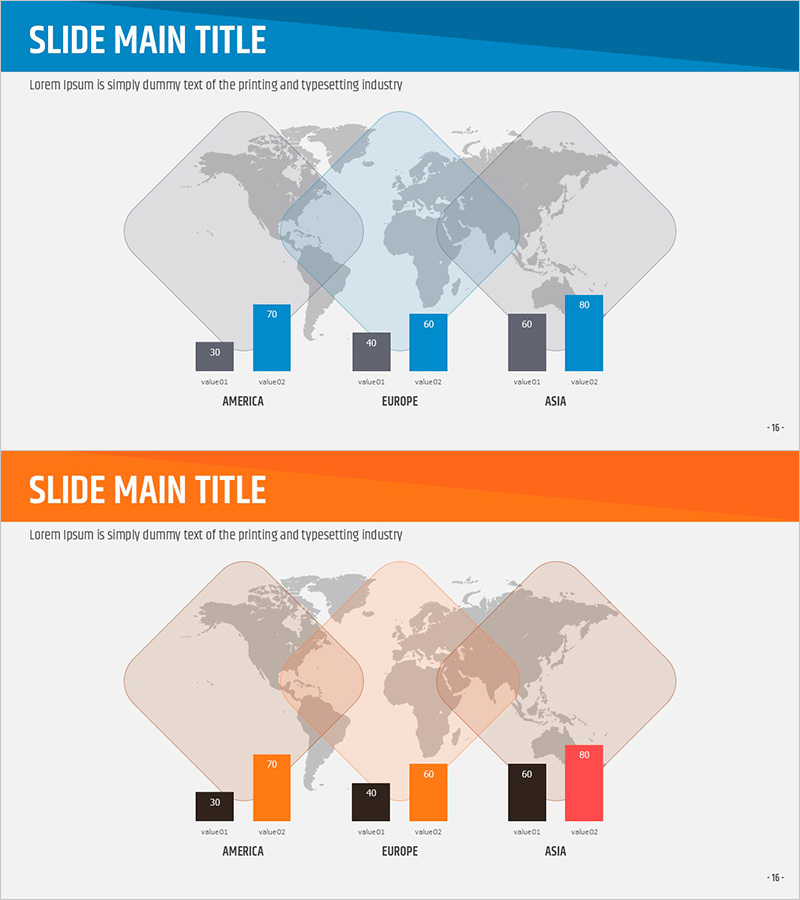
A PowerPoint slide that visualizes regional market analysis using a world map foundation. The rotated diamond-shaped world map highlights three regions—America, Europe, and Asia—with horizontal bar charts below each region to display numerical data. This presentation slide set includes 2 slides: the first features a cool blue and gray color palette, while the second uses warm orange, red, and brown tones. Each slide is designed to compare two data points per region, enabling clear communication of global market status or regional performance comparisons in your presentation. Optimized for 16:9 widescreen format and provided in PPTX for immediate editing.
Usage Points
-
Main Usage
Present global market trends, regional sales performance, cross-country comparisons, and international business data analysis by combining geographic visualization with numerical charts to enhance audience comprehension.
-
How to Use
Replace region names and numerical values with your own data. Select either the blue-toned or orange-toned version to match your corporate brand colors. Suitable for market analysis presentations, sales performance reports, and investor pitch decks.
-
Recommended For
Marketing managers, sales directors, executives, management consultants, and international business professionals presenting regional performance analysis and global strategy. Ideal for business plans, quarterly reports, and investment pitch materials.
-
Slide Structure
2-slide set. Each slide features a rotated diamond-shaped world map with 3 highlighted regions (America, Europe, Asia) and horizontal bar charts positioned below displaying 2 data points per region. First slide uses blue and gray tones; second slide features orange, red, and brown tones.
Related Products
-

Global Target Market Analysis Graph
#Market and Competitor Analysis #Diagram #Graph
-

Horizontal Bar Chart Slide for USA Market Analysis
#Market and Competitor Analysis #Graph #Other
-

Premium Management Presentation Template Map Analysis - Market Analysis and Innovative Strategy
#Market and Competitor Analysis #Marketing Plan and Strategy #Graph
-

Business Plan Presentation Template - World Wide Map
#Market and Competitor Analysis #Financial Plans and Performance #Graph
