Automobile Market Export Volume Visualization Slide – Market Analysis and Strategy
RJ0200044_19
- Last Update 04/10/2025
- File Size 3.1MB
- # of Slides 2
- File Format PPTX
- Slide Ratio 16:9
- Color
Keywords
- #Content-Based Slides
- #Design-Based Slides
- #Market and Competitor Analysis
- #Marketing Plan and Strategy
- #Diagram
- #Other
- #Market Analysis
- #Target Market Strategy
- #Table
- #Standard Table
- #Map
- #16:9
- #world map PowerPoint slide
- #map infographic presentation
- #regional data visualization
- #automobile market analysis slide
- #export volume comparison chart
About the Product
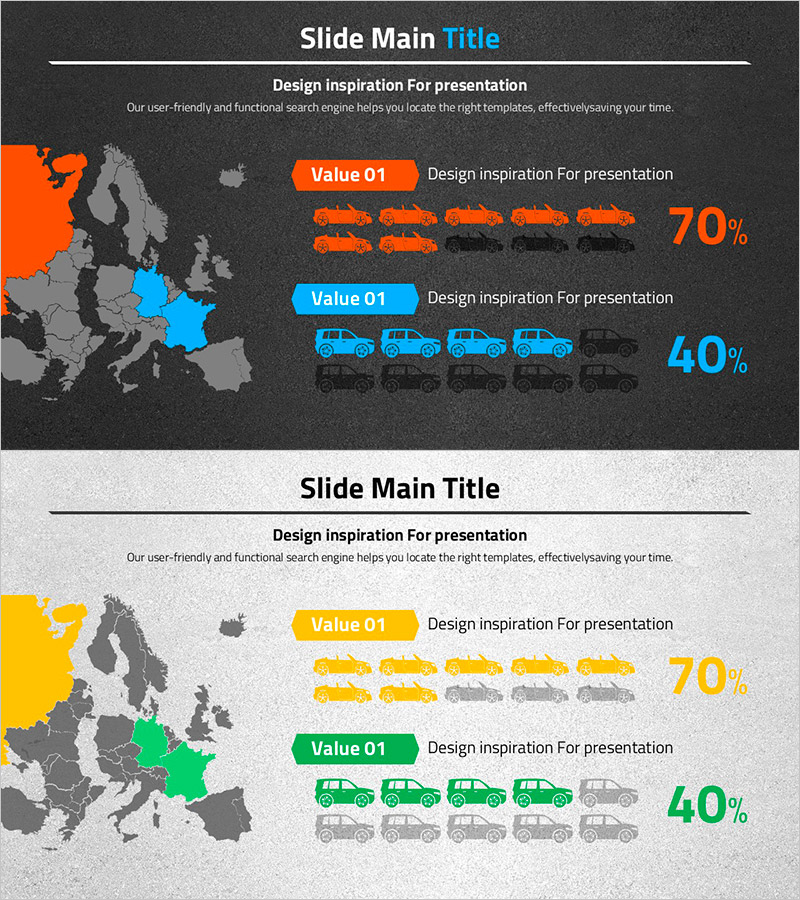
A PowerPoint slide that visualizes regional automobile export volumes using a world map and icon-based graphs. The dark background features orange and blue accent colors highlighting key regions, with car icons displayed in 10-unit increments to intuitively compare export ratios (70%, 40%). The 2-slide set provides the same data in both dark and light background versions, allowing you to select the tone that best fits your presentation environment. Instantly applicable for marketing strategies, market analysis reports, and business presentations where regional performance needs emphasis.
Usage Points
-
Main Usage
Presents regional automobile export performance and market share comparison at a glance. Color-highlighted regions on the world map combined with icon-based numerical representation enhance audience comprehension and engagement.
-
How to Use
Use in marketing strategy presentations, quarterly market analysis reports, investor pitch meetings, and sales team training sessions to emphasize regional performance. Directly edit text and figures to update with the latest data and deploy immediately.
-
Recommended For
Automotive industry marketing and sales professionals, market analysis report writers, executives presenting to stakeholders, global business teams, and industry analysts who need to effectively communicate regional export data to diverse audiences.
-
Slide Structure
Slide 1 (dark background): World map on the left with orange and blue regions highlighted, right side displays car icons in 10-unit increments for each region with 70% and 40% figures. Slide 2 (light background): Identical layout in bright tones for flexibility across projector and print environments.
Related Products
-

Curved Theme Purple Map Template – Market Analysis and Strategy
#Market and Competitor Analysis #Marketing Plan and Strategy #Other
-

Simple Design Trend Wide PPT Map
#Market and Competitor Analysis #Marketing Plan and Strategy #Other
-

Target Market Analysis Table
#Company Introduction #Market and Competitor Analysis #Diagram
-

Purple Curved Theme Map Template for Market and Competitor Analysis
#Market and Competitor Analysis #Marketing Plan and Strategy #Other
