Analysis of 3D Printing Progress – Market Trends and Insights
RJ0400036_33
- Last Update 05/27/2025
- File Size 0.1MB
- # of Slides 2
- File Format PPTX
- Slide Ratio 16:9
- Color
Keywords
- #Content-Based Slides
- #Design-Based Slides
- #Market and Competitor Analysis
- #Graph
- #Market Analysis
- #Industry Trends
- #Column
- #Other
- #Segmented Column
- #Other Charts
- #16:9
- #stacked column chart PowerPoint
- #3-series data visualization slide
- #100% stacked bar chart template
- #comparative analysis graph PPT
- #infographic chart download
About the Product
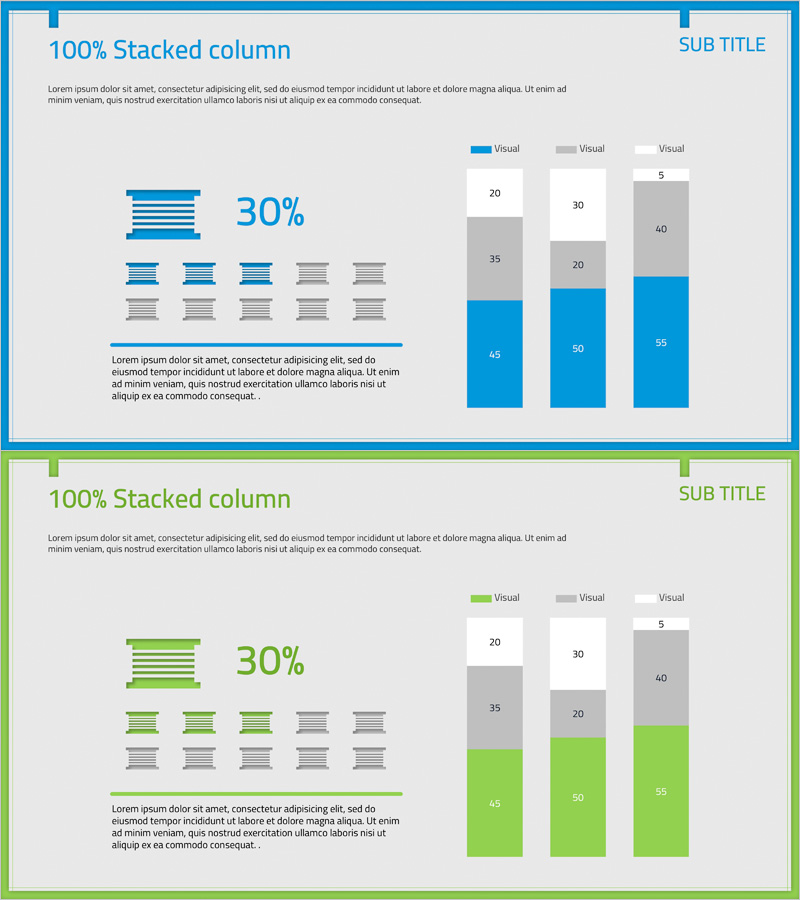
A vertical stacked column chart PowerPoint slide that displays three data series in cumulative format. The chart uses blue, gray, and light gray colors to distinguish each series, with numerical values clearly visible for comparison. The left side features a 30% highlight metric alongside icon arrays for visual support. Optimized for 16:9 widescreen format with 2-slide composition, this infographic template is ready to use in market analysis presentations, business reports, performance comparisons, and strategic planning decks.
Usage Points
-
Main Usage
Designed to compare three or more data series in cumulative format and clearly show the composition ratio of each series relative to the total. Ideal for visualizing market share, product sales composition, budget allocation, organizational structure, and other part-to-whole relationships at a glance.
-
How to Use
The layout presents the key message first through left-side icon arrays and a 30% highlight metric, followed by detailed data comparison using three stacked columns on the right. Color differentiation across series enables intuitive numerical recognition, while the presenter can add context through the title and descriptive text at the top.
-
Recommended For
Recommended for marketing plans, business reports, market analysis documents, financial performance presentations, product sales reports, organizational structure explanations, budget allocation discussions, and performance comparison analyses. Particularly effective when comparing 3–4 categories of data simultaneously.
-
Slide Structure
2-slide composition. Each slide features a two-column layout: left area (title, description, icon arrays, highlight metric) and right area (3 stacked column charts). Columns are color-coded in blue, gray, and light gray representing three data series, with numerical labels (45, 50, 55, etc.) displayed within each column. Optimized for 16:9 widescreen aspect ratio.
Related Products
-

Pork Consumption Stack Chart – Market Trend Analysis
#Market and Competitor Analysis #Graph #Market Analysis
-

Stereographic Segmentation Bar Chart – Visualization of Market Analysis and Trends
#Market and Competitor Analysis #Graph #Market Analysis
-

3D Segmented Bar Graph for Performance Analysis – Market Trends
#Market and Competitor Analysis #Graph #Customer Analysis
-

Visualizing Four-Year Change in Sales – An Effective Tool for Market Analysis
#Market and Competitor Analysis #Graph #Market Analysis
