Vertical Bar Chart for Learning Outcomes Comparison - Market Share Visualization
RB0300006_5
- Last Update 03/09/2025
- File Size 0.3MB
- # of Slides 2
- File Format PPTX
- Slide Ratio 4:3
- Color
Keywords
- #Content-Based Slides
- #Design-Based Slides
- #Market and Competitor Analysis
- #Graph
- #Market Analysis
- #Industry Trends
- #Column
- #Segmented Column
- #4:3
- #stacked vertical bar chart PowerPoint
- #multi-series bar graph template
- #data comparison slide
- #market share visualization
- #performance analysis PPT template
About the Product
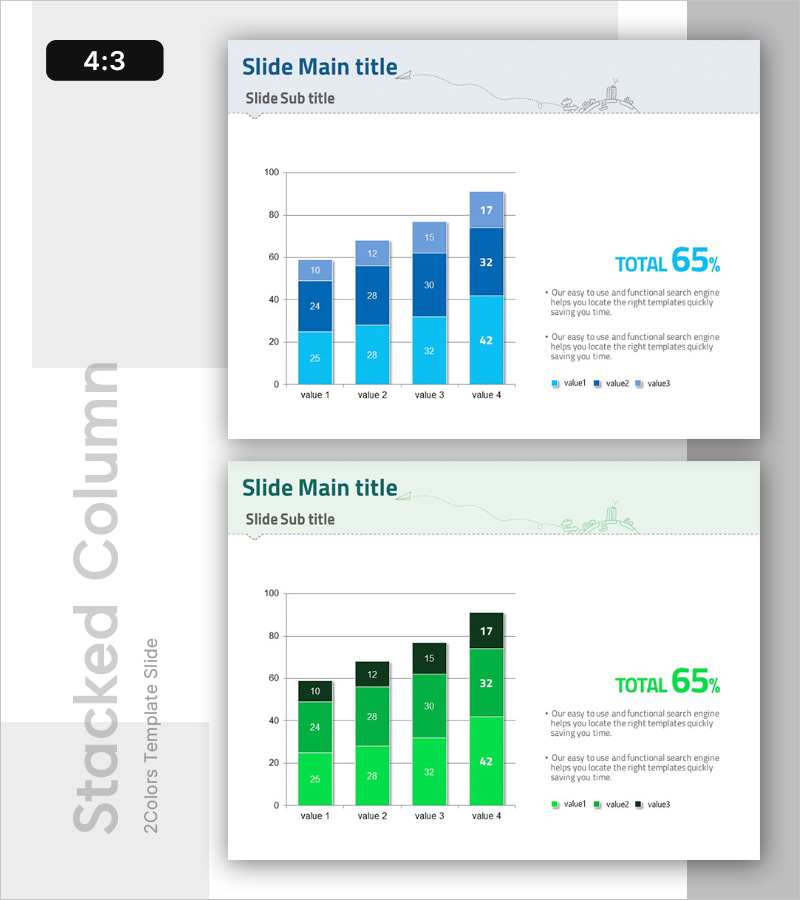
A 2-slide PowerPoint template featuring stacked vertical bar charts for comparing learning outcomes and market share data. Presented in two color schemes—light and dark blue, and light and dark green—each bar is divided into 3 data series to clearly visualize composition ratios. The layout displays 4 items (value 1–4) with numerical values and emphasizes the total percentage on the right side, making it ideal for presentations, reports, and analytical materials. Provided in 4:3 aspect ratio PPTX format, fully editable in all PowerPoint versions.
Usage Points
-
Main Usage
Displays 4 items with 3 data series each, simultaneously showing composition ratios and total percentages. Ideal for comparing learning outcomes, analyzing market share, evaluating sales performance, and assessing departmental results where multi-layered data comparison is essential.
-
How to Use
Bar height and color differentiation allow viewers to instantly grasp item-by-item series data. The percentage display on the right emphasizes proportion relative to the whole. Effective for sequential item explanation or comparative trend analysis during presentations. Easily modify numbers and legends to match your specific data.
-
Recommended For
Executive reports, business performance presentations, marketing analysis materials, learning evaluation results, market research reports, financial analysis presentations, departmental performance reviews, investor pitch decks, and any presentation requiring quantitative data comparison.
-
Slide Structure
2-slide set. Each slide displays a vertical bar chart with 4 items (value 1–4), with each bar divided into 3 color-coded series (value1, value2, value3). Y-axis ranges from 0–100, right side shows total percentage (e.g., 'TOTAL 65%'), and bottom includes item labels and legend in standard layout.
Related Products
-

3D Segmented Bar Graph for Performance Analysis – Market Trends
#Market and Competitor Analysis #Graph #Customer Analysis
-

Graph of Changes After a Healthy Diet – Data Visualization Template
#Market and Competitor Analysis #Graph #Market Analysis
-

Analysis of 3D Printing Progress – Market Trends and Insights
#Market and Competitor Analysis #Graph #Market Analysis
-

Stereographic Segmentation Bar Chart – Visualization of Market Analysis and Trends
#Market and Competitor Analysis #Graph #Market Analysis
