Pork Consumption Stack Chart – Market Trend Analysis
RJ0600041_12
- Last Update 07/01/2025
- File Size 0.5MB
- # of Slides 2
- File Format PPTX
- Slide Ratio 16:9
- Color
Keywords
- #Content-Based Slides
- #Design-Based Slides
- #Market and Competitor Analysis
- #Graph
- #Market Analysis
- #Industry Trends
- #Column
- #Other
- #Segmented Column
- #Other Charts
- #16:9
- #stacked column chart PowerPoint
- #100% stack chart template
- #data visualization slide
- #proportion comparison chart
- #market share PowerPoint slide
About the Product
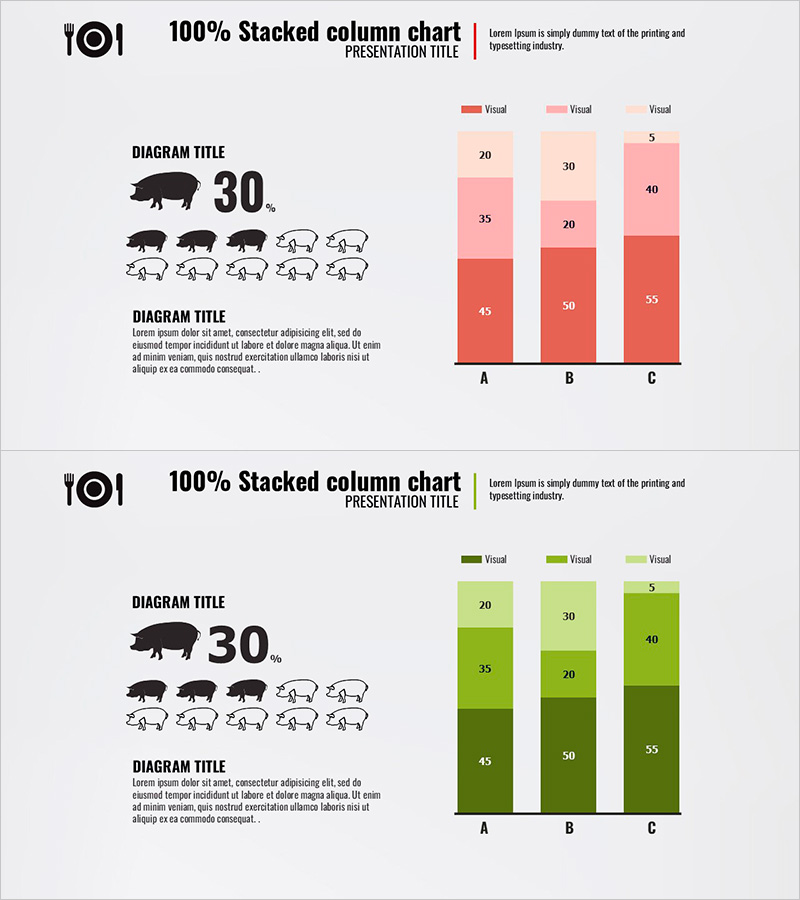
A PowerPoint slide featuring a 100% stacked column chart that visualizes three data series in proportional segments. Two color schemes are provided: red-pink-light pink gradient and green-tone versions. Each column displays items A, B, and C with stacked segments, accompanied by a left-side diagram section with silhouette icon and 30% emphasis. Ideal for market share analysis, consumption composition, and comparative ratio presentations. Includes 2 slides in 16:9 widescreen PPTX format, fully editable and ready to use.
Usage Points
-
Main Usage
Effectively communicates market share, consumption composition, and sales distribution by showing each component's proportion relative to the whole. The 100% baseline normalizes data, making relative changes across categories immediately apparent.
-
How to Use
Place key metrics and icons in the left diagram section, then arrange the three-series stacked columns in the right graph area. Each column totals 100% height with proportional segments. Insert numeric labels within segments to display exact percentages.
-
Recommended For
Marketing reports, market analysis presentations, product sales performance reviews, consumption trend analysis, and financial reports. Particularly effective for executive briefings, investor presentations, and marketing team discussions where composition ratios and comparative trends must be shown simultaneously.
-
Slide Structure
2 slides total. Each slide divides into left information zone (icon, metrics, descriptive text) and right graph zone (3 stacked columns for items A, B, C). Two color versions: red-pink-light pink gradient and green-tone. 16:9 widescreen format, fully editable PPTX.
Related Products
-

Analysis of 3D Printing Progress – Market Trends and Insights
#Market and Competitor Analysis #Graph #Market Analysis
-

Graph of Changes After a Healthy Diet – Data Visualization Template
#Market and Competitor Analysis #Graph #Market Analysis
-

5-Year Real Estate Volume Chart – Market Analysis
#Market and Competitor Analysis #Graph #Market Analysis
-

Visualization of Learning Response Data – Market Trend Analysis
#Market and Competitor Analysis #Graph #Future Outlook
