Sales and Profit Table Diagram
RJ0400036_27
- Last Update 05/27/2025
- File Size 0.3MB
- # of Slides 2
- File Format PPTX
- Slide Ratio 16:9
- Color
Keywords
- #Content-Based Slides
- #Design-Based Slides
- #Financial Plans and Performance
- #Diagram
- #Income Statement
- #Sales and Revenue
- #Table
- #16:9
- #sales profit table PowerPoint
- #financial data presentation slide
- #comparison table PPT design
- #financial performance chart slide
- #how to create financial tables in PowerPoint
About the Product
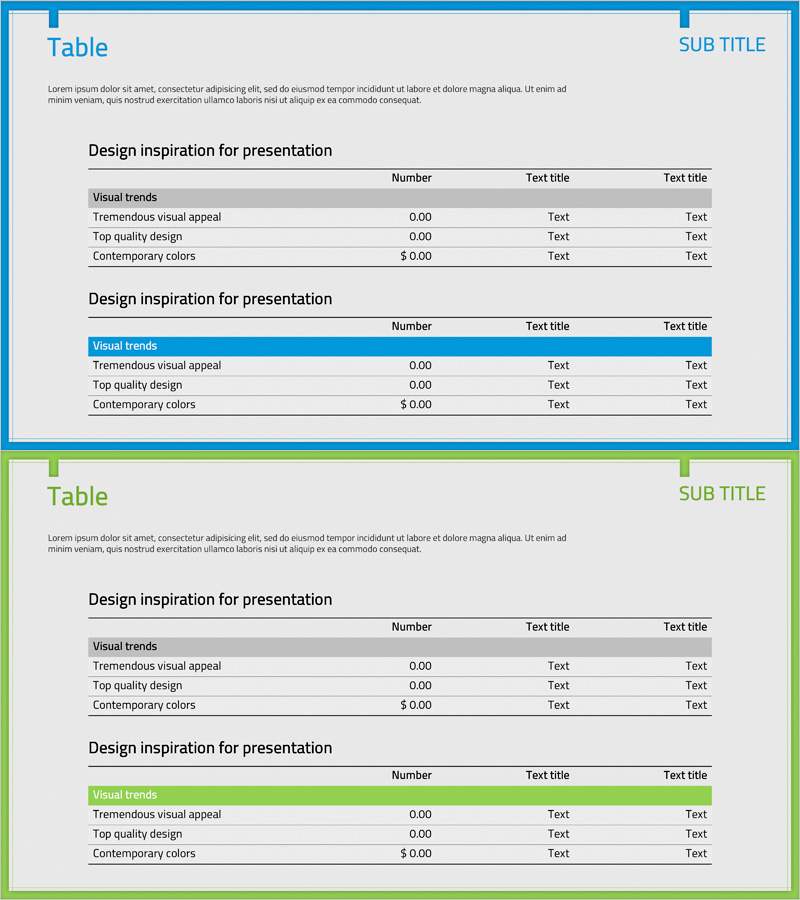
A financial data PowerPoint slide that clearly presents sales and profit information in table format. This 2-slide set features a gray-background table on the first slide and a blue-header emphasized data visualization layout on the second slide. Each table accommodates three rows of data including visual trends, quality metrics, and color information, with dedicated number and text fields for entering financial figures and descriptions. The slide structure enables simultaneous display of numerical data and explanatory text, making it immediately applicable for investor presentations, financial reports, and business plans.
Usage Points
-
Main Usage
This slide communicates financial performance and profitability through numerical data in a clear, organized format. It arranges key financial metrics such as revenue, net profit, and operating income in table form, enabling decision-makers and investors to grasp financial status at a glance.
-
How to Use
Enter quarterly or annual sales data into the basic table on the first slide, then input core profitability metrics into the emphasized table on the second slide. Edit each cell's numbers and text to replace with actual financial data immediately, and adjust colors and fonts to match your presentation context.
-
Recommended For
Ideal for CFOs, finance managers, investor relations officers, and executives presenting financial performance. Particularly useful in quarterly earnings presentations, annual financial reports, investor pitch decks, and the financial section of business plans.
-
Slide Structure
Two-slide set with each slide featuring a 3-row × 3-column table structure (number, text title, text title). The first slide presents a gray-tone basic table, while the second slide features a blue-header emphasized table, both providing identical data input areas for comparative analysis.
Related Products
-

Sales and Profit Table – Financial Performance Visualization
#Financial Plans and Performance #Diagram #Income Statement
-

Income Statement Table – Clear Visualization of Financial Performance
#Financial Plans and Performance #Diagram #Income Statement
-

Mobile Finance Business Sales and Profit Statement – Transparent Financial Performance
#Financial Plans and Performance #Diagram #Income Statement
-

Illustration Theme Income Statement Table – A Fresh Perspective on Financial Data
#Financial Plans and Performance #Diagram #Income Statement
