Transportation Business Sales and Profit Table – Financial Analysis
RJ0300019_10
- Last Update 04/22/2025
- File Size 10.9MB
- # of Slides 2
- File Format PPTX
- Slide Ratio 16:9
- Color
Keywords
- #Content-Based Slides
- #Design-Based Slides
- #Financial Plans and Performance
- #Diagram
- #Income Statement
- #Sales and Revenue
- #Table
- #Standard Table
- #Vertical Table
- #16:9
- #financial table PowerPoint
- #sales profit analysis slide
- #vertical table template
- #income statement PPT
- #transportation business financial planning
- #data table slide design
About the Product
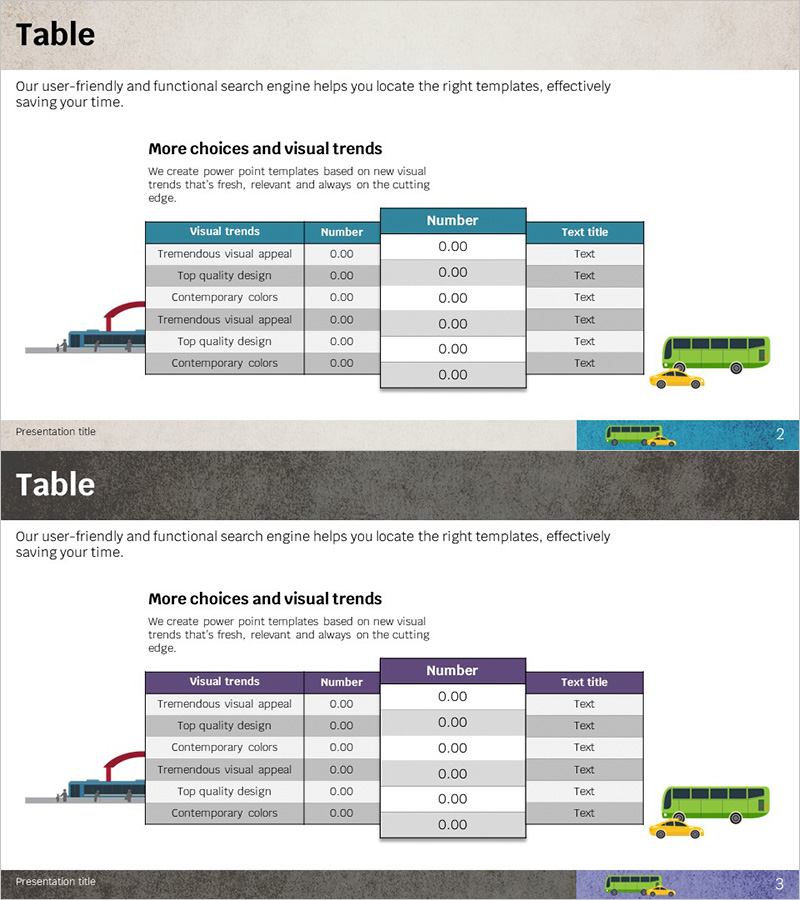
A vertical financial table PowerPoint slide designed for transportation business financial planning and analysis. This presentation template organizes sales and profit data across 4 rows (sales revenue, operating expenses, net profit, profit margin) and 3 columns (item, number, text title), presenting financial information in an income statement format. The teal header and gray data cells create clear information hierarchy, enabling intuitive communication of financial metrics. The 2-slide set includes color variations (teal and purple headers) that adapt to different presentation themes and corporate branding.
Usage Points
-
Main Usage
Organize and present financial metrics for transportation, logistics, or transit companies by displaying sales revenue, operating expenses, net profit, and profit margin in a structured table format. The income statement layout effectively communicates financial health and performance to investors, employees, and stakeholders with data-driven clarity.
-
How to Use
Apply this slide in business plans, investor pitch decks, quarterly earnings reports, and financial analysis presentations. Select header color (teal or purple) to match your presentation theme or corporate identity, then input your financial data directly into editable cells for immediate use in your PowerPoint deck.
-
Recommended For
Finance managers, CFOs, executives, investment professionals, and consultants who need to present financial data and analysis. Ideal for transportation, transit, logistics, taxi, and bus companies; banking and securities firms conducting corporate analysis; and management consulting reports requiring financial performance visualization.
-
Slide Structure
2-slide set featuring vertical financial tables with 4 rows (sales revenue, operating expenses, net profit, profit margin) and 3 columns (item, number, text title). First slide includes teal header; second slide features purple header for color variation. All cells are editable fields designed for direct data input and customization.
Related Products
-

Business Income Statement Slide - Highlighting Financial Performance
#Financial Plans and Performance #Diagram #Income Statement
-

Business Income Statement – Visualizing Financial Performance
#Financial Plans and Performance #Diagram #Income Statement
-

Global Revenue Analysis Table – Table for Financial Performance Enhancement
#Financial Plans and Performance #Diagram #Other
-

Sales and Profit Calculation Table – Efficient Profit Management
#Financial Plans and Performance #Diagram #Income Statement
