Illustration Theme Income Statement Table – A Fresh Perspective on Financial Data
RJ0300045_32
- Last Update 04/30/2025
- File Size 0.4MB
- # of Slides 2
- File Format PPTX
- Slide Ratio 16:9
- Color
Keywords
- #Content-Based Slides
- #Design-Based Slides
- #Financial Plans and Performance
- #Diagram
- #Income Statement
- #Sales and Revenue
- #Table
- #Standard Table
- #16:9
- #income statement table PowerPoint
- #financial data table slide
- #budget comparison template
- #accounting table PPT
- #financial report slide design
- #expense analysis presentation
About the Product
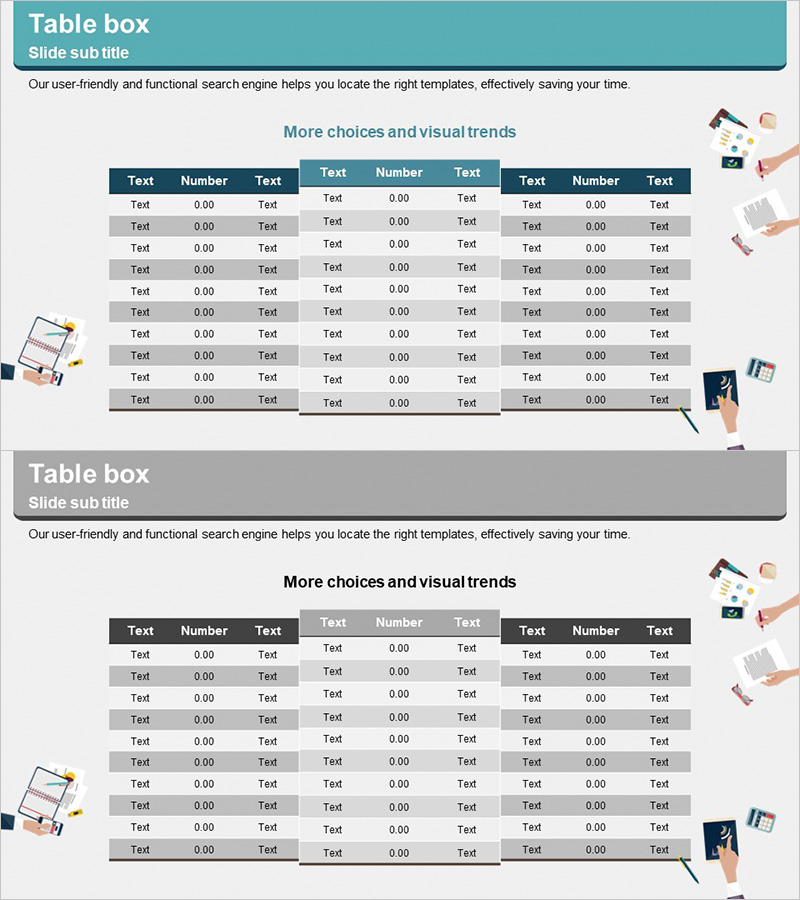
A three-column income statement table PowerPoint slide designed to clearly organize and present financial data. This horizontally-oriented table layout separates text and numeric input fields, making it ideal for visualizing financial status, budget comparisons, and performance analysis. Illustration elements enhance readability in presentations, and the fully editable PPTX format allows immediate customization for your specific financial reporting needs.
Usage Points
-
Main Usage
Clearly communicate financial information such as revenue status, budget comparisons, and performance metrics using a structured table format. The separated text and numeric fields maximize data readability, and real-time editing during presentations is seamless.
-
How to Use
Use in financial reports, business plans, and investor presentations to organize income statements, revenue summaries, and cost analyses. Input text and numbers into each cell, then adjust colors and fonts as needed to highlight key financial metrics and trends.
-
Recommended For
Ideal for CFOs, finance managers, executives, and investor presentations. Recommended for quarterly and annual financial reports, budget planning meetings, and investment pitch decks. Supports credible presentations in finance, accounting, and business management sectors.
-
Slide Structure
Two-slide set, each featuring a horizontal table with 3 columns (text, number, text) and 9-10 rows. The header row is highlighted in dark color for emphasis, while data rows alternate between white and gray backgrounds for clear row distinction and improved readability.
Related Products
-

Global Revenue Analysis Table – Table for Financial Performance Enhancement
#Financial Plans and Performance #Diagram #Other
-

Sales and Profit Table – Clear Visualization of Financial Planning
#Financial Plans and Performance #Diagram #Other
-

Sales and Profit Analysis Chart – An Effective Tool for Financial Performance
#Financial Plans and Performance #Diagram #Income Statement
-

Stylish Design for Data Visualization – Business Insights
#Financial Plans and Performance #Diagram #Income Statement
