Competitive Comparison Analysis Bar Graph – Visualizing Market Advantage
RJ0400036_26
- Last Update 05/27/2025
- File Size 0.2MB
- # of Slides 2
- File Format PPTX
- Slide Ratio 16:9
- Color
Keywords
- #Content-Based Slides
- #Design-Based Slides
- #Market and Competitor Analysis
- #Graph
- #Competitor Analysis
- #Competitive Advantage
- #Horizontal Bar
- #Double Horizontal Bar
- #16:9
- #dual bar chart PowerPoint
- #competitive analysis slide template
- #horizontal bar graph comparison
- #market advantage visualization
- #PowerPoint bar chart slide design
About the Product
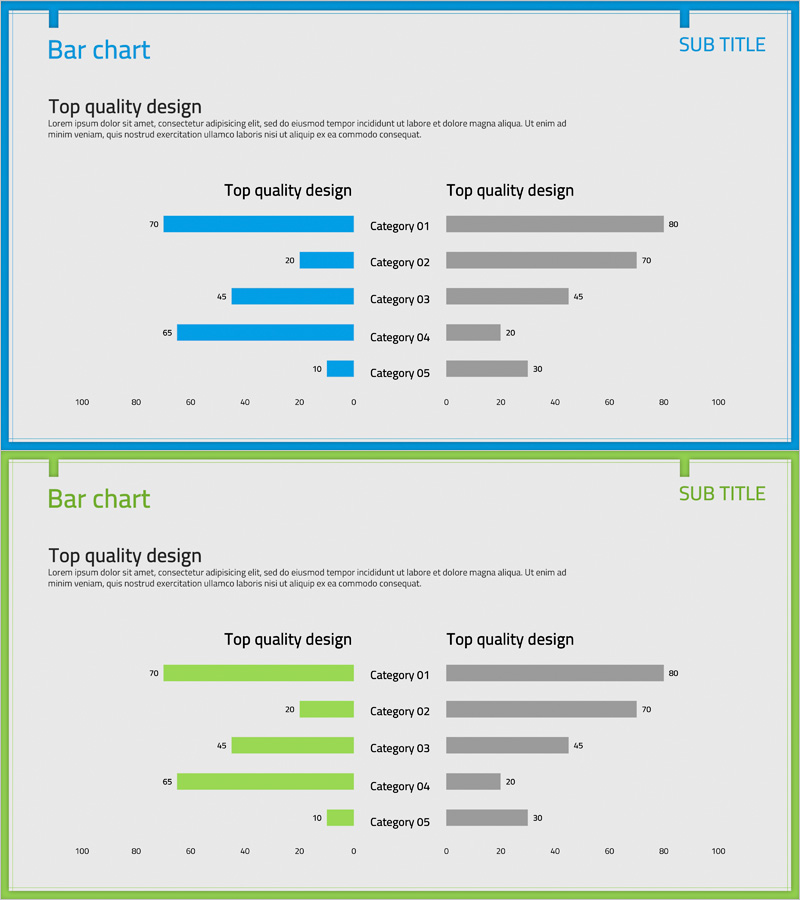
A dual bar chart PowerPoint slide optimized for competitive analysis and market positioning comparison. This presentation template visualizes two data series—blue bars on the left and gray bars on the right—across five categories (Category 01 through 05), making numerical comparisons immediately clear. The layout is ideal for competitive advantage analysis, market share comparison, performance metrics benchmarking, and strategic positioning presentations. Delivered in 16:9 widescreen format with 2 fully editable slides ready for instant customization.
Usage Points
-
Main Usage
Compare your company's performance metrics against competitors using a side-by-side bar chart format. Ideal for visualizing quantitative data such as market share, customer satisfaction scores, pricing competitiveness, and technology capabilities. Delivers compelling visual evidence for executive presentations, investor pitches, and strategic planning meetings.
-
How to Use
Replace the five category labels and numerical values with your own data. Assign the blue bars to represent your company or Product A, and gray bars to represent competitors or Product B, establishing clear comparison context. Bar lengths and values synchronize automatically, so simply input your data and the visualization is complete.
-
Recommended For
Ideal for executives, business development teams, marketing departments, and strategic planning teams presenting competitive analysis findings. Particularly effective for new market entry evaluations, competitive positioning strategy presentations, quarterly performance comparisons, and situations requiring quantitative evidence of competitive advantage.
-
Slide Structure
Two data series (blue and gray) are displayed in left-right contrast across five categories. The left axis runs from 0–100 in reverse direction, while the right axis runs 0–100 in standard direction, enabling symmetric data comparison. Numerical labels appear above each bar, with category names centered for optimal readability.
Related Products
-

Business Analysis Bilinear Bar Graph
#Market and Competitor Analysis #Graph #Competitor Analysis
-

Sailing Travel Service Company and Competitor Analysis Dual Horizontal Chart
#Market and Competitor Analysis #Graph #Competitor Analysis
-

Competitor Analysis and Competitive Advantage Double Bar Chart
#Market and Competitor Analysis #Graph #Competitor Analysis
-

Office Supplies Theme Double Bar Graph – Clear Visualization of Data
#Market and Competitor Analysis #Graph #Competitor Analysis
