Cement Theme Competitor Analysis Graph – Market Insights
RJ0300058_28
- Last Update 05/03/2025
- File Size 2.3MB
- # of Slides 2
- File Format PPTX
- Slide Ratio 16:9
- Color
Keywords
- #Content-Based Slides
- #Design-Based Slides
- #Market and Competitor Analysis
- #Graph
- #Competitor Analysis
- #Competitive Advantage
- #Horizontal Bar
- #Double Horizontal Bar
- #16:9
- #dual horizontal bar chart PowerPoint
- #left-right comparison graph
- #competitor analysis slide
- #market comparison chart
- #horizontal bar graph template
About the Product
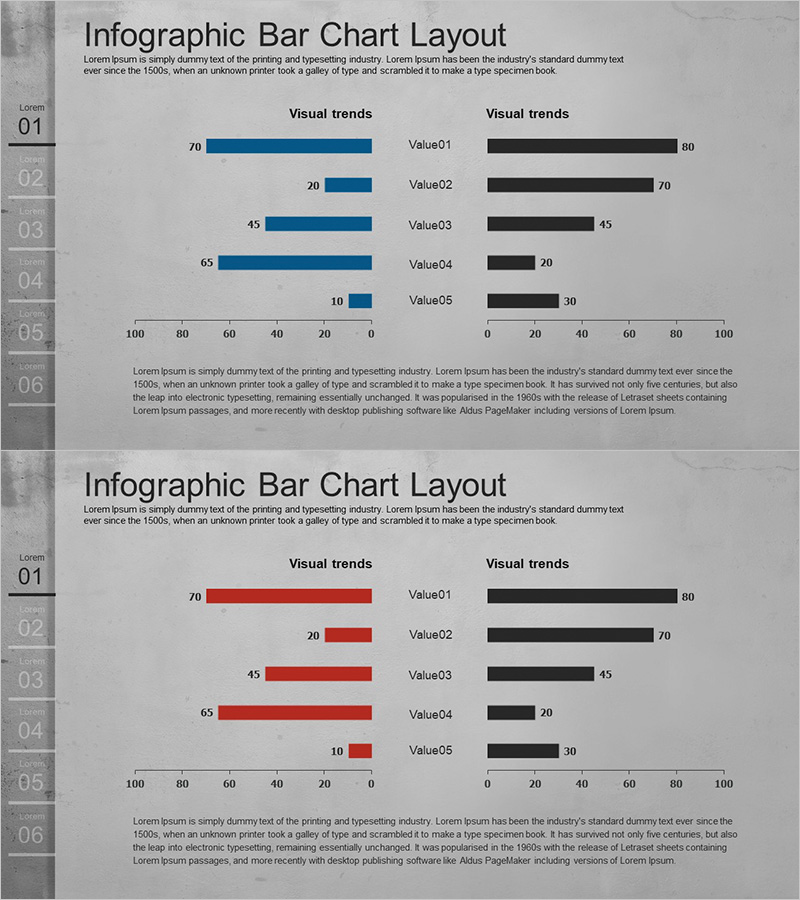
A dual horizontal bar chart PowerPoint slide optimized for competitor analysis and market comparison. This presentation template visualizes two data series with contrasting blue bars on the left and black bars on the right, enabling intuitive representation of competitive relationships. The slide structure accommodates five items (Value01 through Value05) with numerical values ranging from 0 to 100, positioned symmetrically on both sides of a central axis. Ideal for comparing market share, customer satisfaction scores, pricing competitiveness, and other bilateral metrics. The concrete gray theme background and clean axis layout integrate seamlessly into business presentations and strategic reports, ready for immediate use in executive briefings.
Usage Points
-
Main Usage
Compare two competing entities, markets, or products using quantitative data in executive presentations. Visualize competitor analysis, market share distribution, customer satisfaction ratings, and pricing competitiveness. The symmetric layout clearly presents comparative metrics to support strategic decision-making and stakeholder communication.
-
How to Use
Input numerical values into the left blue bars and right black bars for each of the five items. The 0–100 axis scale ensures symmetrical positioning, making relative size comparisons immediately apparent. Customize item labels and values to adapt the slide to various competitive analysis scenarios and business contexts.
-
Recommended For
Executive strategy presentations, competitive positioning analysis in sales pitches, investor relations briefings, management consulting reports, and market benchmarking sections. Recommended for any business presentation requiring quantitative bilateral comparison and data-driven competitive insights.
-
Slide Structure
Two-slide set, each featuring five items (Value01–Value05) with dual horizontal bars positioned symmetrically around a central 0–100 axis. Left bars in blue, right bars in black. Header displays 'Visual trends' with legend; footer includes descriptive text area for contextual information and data interpretation.
Related Products
-

Gender Ratio Bar Graph – Market and Competitor Analysis
#Market and Competitor Analysis #Graph #Competitor Analysis
-

Technology Services Competitor Analysis and Advantage – Horizontal Bar Chart Slide
#Market and Competitor Analysis #Graph #Competitor Analysis
-

Competitor Analysis Double Bar Graph – Visualizing Competitive Advantage
#Market and Competitor Analysis #Graph #Competitor Analysis
-

Competitor Analysis Thin Bar Graph – Visualizing Market Competitive Advantage
#Market and Competitor Analysis #Graph #Competitor Analysis
