Business Analysis Bilinear Bar Graph
RJ0300059_25
- Last Update 05/04/2025
- File Size 2.4MB
- # of Slides 2
- File Format PPTX
- Slide Ratio 16:9
- Color
Keywords
- #Content-Based Slides
- #Design-Based Slides
- #Market and Competitor Analysis
- #Graph
- #Competitor Analysis
- #Competitive Advantage
- #Horizontal Bar
- #Double Horizontal Bar
- #16:9
- #bilinear bar chart PowerPoint
- #comparative analysis slide template
- #competitor comparison graph
- #business analysis chart
- #horizontal bar graph PPT template
About the Product
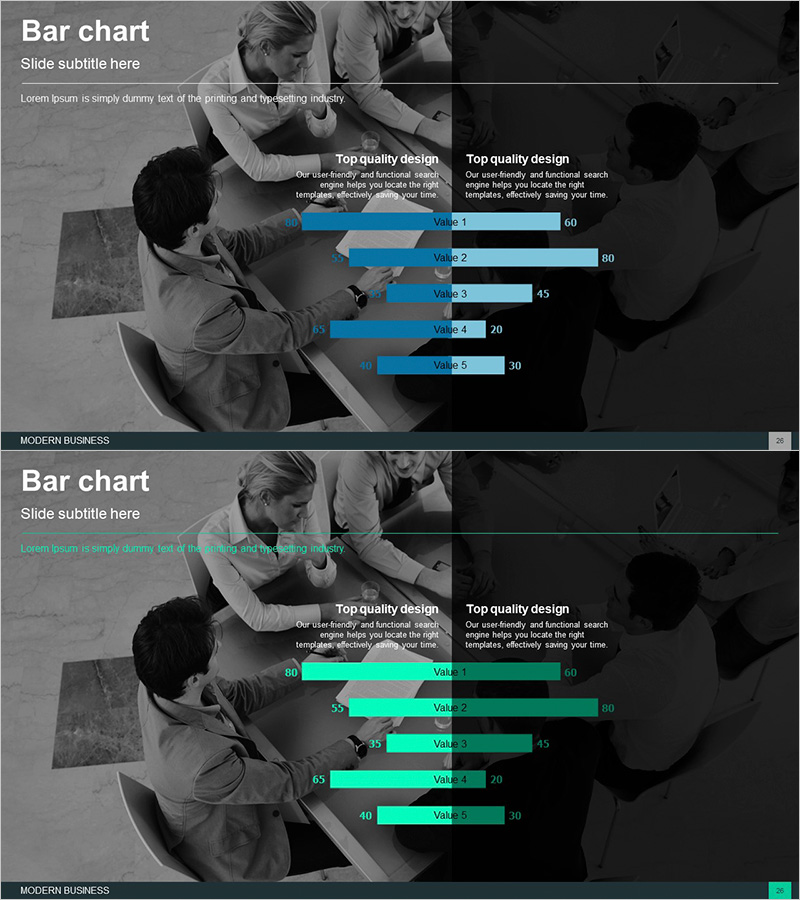
A horizontal bar chart PowerPoint template optimized for business analysis and competitive comparison. This slide features a symmetrical left-right structure displaying two data series simultaneously, with blue and black dual-tone coloring for clear contrast. Five items are compared side-by-side, making it ideal for market analysis, competitor benchmarking, and performance comparison presentations. The 16:9 widescreen format includes 2 fully editable slides that integrate seamlessly into your presentation deck.
Usage Points
-
Main Usage
Displays two data series side-by-side using symmetrical horizontal bars for direct comparison. Effectively visualizes competitive positioning, market share comparison, departmental performance metrics, and any dual-dataset analysis requiring visual contrast.
-
How to Use
Input numerical values into the left and right bar segments for each of the five items to compare two groups. Maintain the blue and black color scheme or customize with corporate colors. Insert into executive reports, strategy meetings, and marketing presentations.
-
Recommended For
Ideal for executives, planning teams, marketing departments, and sales teams presenting competitor analysis, market research findings, departmental performance comparisons, and year-over-year results. Supports data-driven decision-making presentations.
-
Slide Structure
2-slide set. Each slide contains 5 bilinear bar pairs (left: blue, right: black) with numerical labels, legend, title area, and business background imagery for professional appearance.
Related Products
-

Competitor Analysis Double Bar Graph – Visualizing Competitive Advantage
#Market and Competitor Analysis #Graph #Competitor Analysis
-

Competitive Advantage 3D Bi-directional Bar Graph – Essential Tool for Market Analysis
#Market and Competitor Analysis #Graph #Competitor Analysis
-

Competitor Analysis Bilinear Bar Graph – Identify Market Advantage
#Market and Competitor Analysis #Graph #Competitor Analysis
-

Competitive Comparison Analysis Bar Graph – Visualizing Market Advantage
#Market and Competitor Analysis #Graph #Competitor Analysis
