Competitor Analysis and Advantage Chart – The Harmony of Blue and Red
RJ0400020_29
- Last Update 05/23/2025
- File Size 0.2MB
- # of Slides 2
- File Format PPTX
- Slide Ratio 16:9
- Color
Keywords
- #Content-Based Slides
- #Design-Based Slides
- #Market and Competitor Analysis
- #Graph
- #Competitor Analysis
- #Competitive Advantage
- #Horizontal Bar
- #Double Horizontal Bar
- #16:9
- #diverging bar chart PowerPoint
- #horizontal bar graph template
- #competitor analysis slide
- #left-right comparison chart
- #how to create bar chart in PowerPoint
About the Product
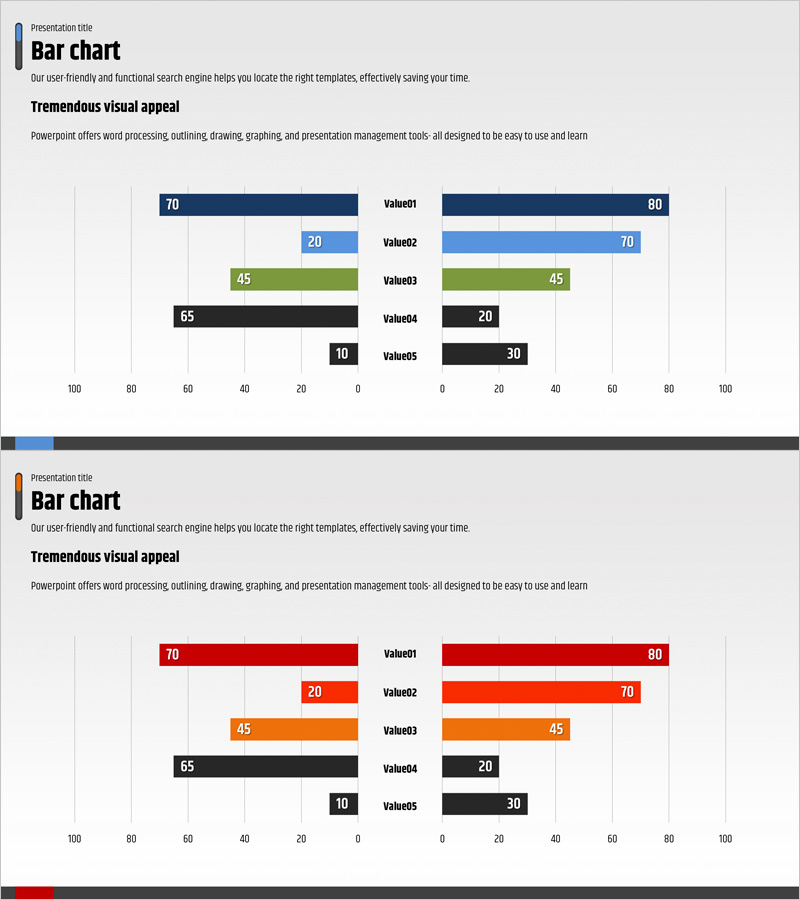
A diverging bar chart PowerPoint slide optimized for competitor analysis and advantage comparison. The left side uses dark blue and the right side uses red to clearly distinguish two data series, displaying five items (Value01 through Value05) simultaneously. Each bar includes numerical labels for precise data comparison, with a symmetrical layout centered on a baseline axis. This design is ideal for competitive positioning, performance benchmarking, pros-and-cons analysis, and other comparative presentations. The 2-slide template is ready for immediate editing and customization.
Usage Points
-
Main Usage
Visualizes two-way numerical comparisons for competitor analysis, performance benchmarking, and pros-and-cons evaluation. The symmetrical left-right layout maximizes contrast effect and clearly communicates quantitative differences across five data points.
-
How to Use
Set the left bar as the reference item (e.g., competitor) and the right bar as the comparison item (e.g., your company). Input numerical values and bar lengths adjust automatically. Colors and labels are fully editable. Suitable for business reports, marketing presentations, investor pitches, and strategic reviews.
-
Recommended For
Marketing managers, sales executives, strategy planners, and consultants who need to present quantitative comparative analysis. Particularly effective for competitive analysis, performance evaluation, and market research presentations.
-
Slide Structure
2-slide template with symmetrical layout centered on a baseline axis. Left bars (dark blue) and right bars (red) are vertically aligned with five items (Value01–Value05). Numerical labels appear at the end of each bar for precise data visualization and comparison.
Related Products
-

Competitor Analysis Thin Bar Graph – Visualizing Market Competitive Advantage
#Market and Competitor Analysis #Graph #Competitor Analysis
-

Sailing Travel Service Company and Competitor Analysis Dual Horizontal Chart
#Market and Competitor Analysis #Graph #Competitor Analysis
-

Business Analysis Bilinear Bar Graph
#Market and Competitor Analysis #Graph #Competitor Analysis
-

Eco-Friendly Business Goal Market Strategy Horizontal Bar Chart
#Market and Competitor Analysis #Graph #Competitor Analysis
