Detailed Bar Analysis Graph – Market and Competitor Insights
RJ0400036_23
- Last Update 05/27/2025
- File Size 0.1MB
- # of Slides 2
- File Format PPTX
- Slide Ratio 16:9
- Color
Keywords
- #Content-Based Slides
- #Design-Based Slides
- #Market and Competitor Analysis
- #Graph
- #Competitor Analysis
- #Market Analysis
- #Horizontal Bar
- #Segmented Horizontal Bar
- #16:9
- #detailed horizontal bar chart PowerPoint
- #competitor analysis slide template
- #market analysis presentation
- #multi-series bar graph
- #how to create horizontal bar chart in PowerPoint
- #data comparison slide download
About the Product
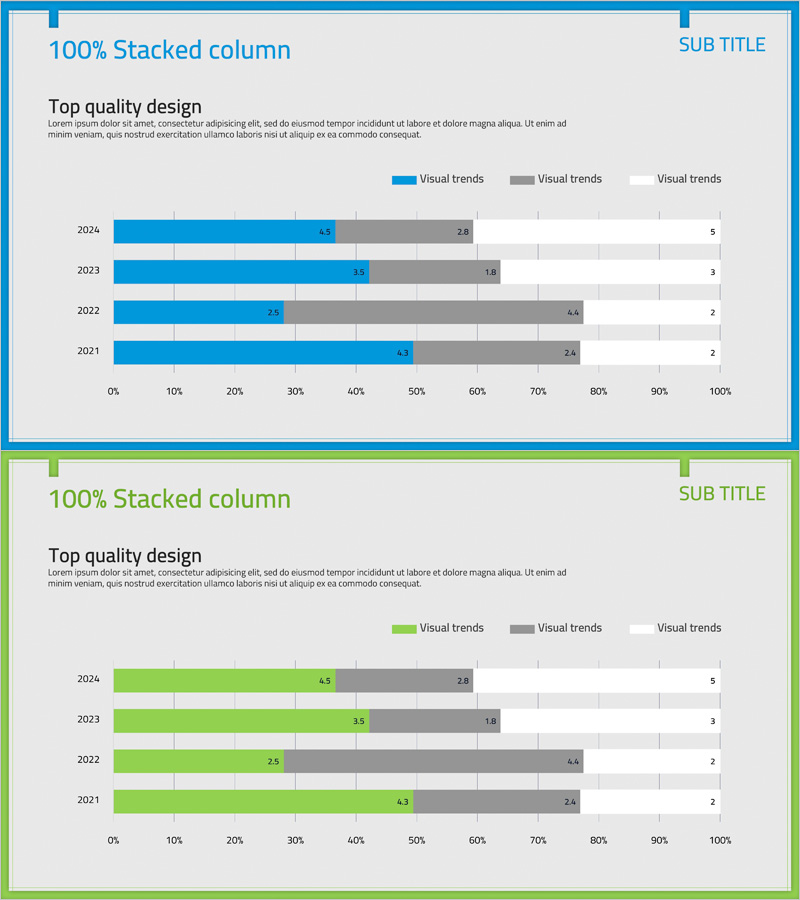
A detailed horizontal bar chart PowerPoint slide optimized for market analysis and competitive comparison. Visualizes four data series across years 2021–2024 with numeric labels on each bar for precise value comparison. Features a professional color palette of blue, gray, and light gray tones that clearly distinguish data layers. Ideal for presentations, reports, and business proposals where you need to effectively communicate competitive positioning, market share, performance trends, and strategic insights.
Usage Points
-
Main Usage
Compare and analyze four or more data series across multiple years, such as market size, competitor market share, sales performance, and key metrics. Numeric labels on each bar enable instant value recognition, making it ideal for reports, business plans, and investor presentations.
-
How to Use
Open the slide, select the chart, and input your data into the data table. The bar chart updates automatically. Customize colors, label positions, and axis ranges using PowerPoint's built-in chart tools. Add additional data series by inserting new rows in the data table.
-
Recommended For
Marketing managers, executives, consultants, financial analysts, and business strategists presenting market conditions, competitive analysis, and performance comparisons. Suitable for quarterly and annual performance reviews, departmental goal achievement tracking, customer satisfaction trends, and strategic benchmarking.
-
Slide Structure
2-slide set. First slide features blue-toned 4-bar horizontal chart (2021–2024); second slide uses green-toned bars with identical structure. Each bar includes numeric labels, legend, and 0–100% horizontal axis scale. 16:9 widescreen format, PPTX file type.
Related Products
-

VR Market Analysis Bar Graph – Understanding Competitive Landscape
#Market and Competitor Analysis #Graph #Competitor Analysis
-

Market Analysis Graph Ahead of the Future – Innovative Business Insights
#Market and Competitor Analysis #Diagram #Graph
-

Horizontal Bar Graph Broken Down by Year – Optimal for Market and Competitor Analysis
#Market and Competitor Analysis #Graph #Competitor Analysis
-

Space Industry Market Analysis Bar Graph – Providing Strategic Insights
#Market and Competitor Analysis #Graph #Competitor Analysis
