Detailed Emphasis Bar Graph for Market and Competitor Analysis
RJ0700011_14
- Last Update 07/24/2025
- File Size 0.3MB
- # of Slides 2
- File Format PPTX
- Slide Ratio 16:9
- Color
Keywords
- #Content-Based Slides
- #Design-Based Slides
- #Market and Competitor Analysis
- #Graph
- #Competitor Analysis
- #Market Analysis
- #Horizontal Bar
- #Segmented Horizontal Bar
- #16:9
- #horizontal bar chart PowerPoint
- #market analysis presentation slide
- #competitor comparison graph
- #4-year trend chart
- #dual-series bar graph
- #data visualization PPT
- #business analysis slide template
About the Product
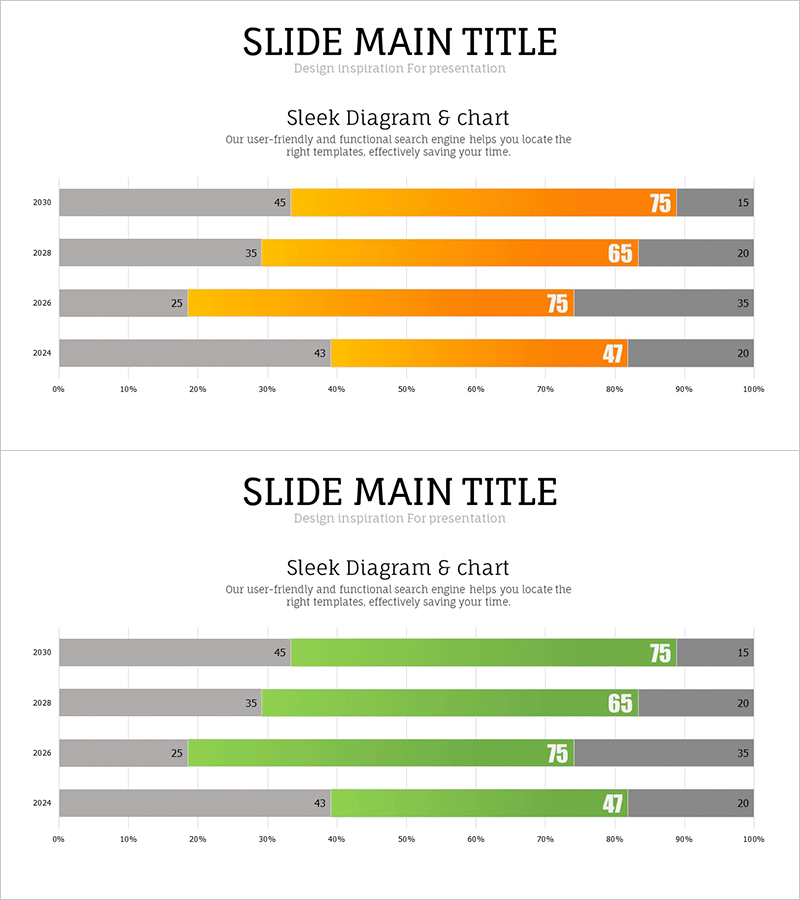
A horizontal bar chart PowerPoint slide optimized for market analysis and competitor comparison. This presentation template visualizes four years of data from 2024 to 2030 using orange and gray dual-series bars, clearly showing trend changes over time. The structure allows simultaneous comparison of three metrics per year, making it ideal for analyzing market size, market share, growth rates, and other composite indicators. Optimized for 16:9 widescreen format with 2-slide composition, ready for immediate editing and insertion into presentations, reports, and business proposals.
Usage Points
-
Main Usage
This slide presents year-over-year trend data such as market size, market share, and growth rates using horizontal bar charts. The dual-series structure with orange and gray bars enables simultaneous display of two metrics, intuitively communicating competitive advantage or market change trends.
-
How to Use
Insert into the market analysis section of business plans, marketing proposals, or investor pitch decks. Designed for easy data input—simply copy and paste actual figures and bar lengths adjust automatically. Colors and numerical labels are fully editable to match your brand or presentation style.
-
Recommended For
Marketing, planning, and strategy professionals analyzing market conditions and competitive landscape. Suitable for executive briefings, investor presentations, and internal meetings. Essential for industry analysis, business feasibility studies, and performance comparison materials requiring quantitative data-driven decision-making.
-
Slide Structure
2-slide composition with each slide displaying 4 years (2030, 2028, 2026, 2024) on the vertical axis. Each year features three horizontal bars—orange (primary metric), gray (comparison metric), and gray (additional item)—extending across the slide with numerical labels at bar ends. A 0%–100% horizontal scale with clear gridlines supports accurate numerical comparison.
Related Products
-

VR Market Analysis Bar Graph – Understanding Competitive Landscape
#Market and Competitor Analysis #Graph #Competitor Analysis
-

Chemical Experiment Analysis Horizontal Bar Graph
#Market and Competitor Analysis #Graph #Competitor Analysis
-

Blue Green Subdivided Graph – Template for Market and Competitor Analysis
#Market and Competitor Analysis #Graph #Competitor Analysis
-

Market Analysis Graph Ahead of the Future – Innovative Business Insights
#Market and Competitor Analysis #Diagram #Graph
