Analysis of the Bar Graph by Year – Competitive Edge Insights
RJ0300081_21
- Last Update 05/11/2025
- File Size 0.1MB
- # of Slides 2
- File Format PPTX
- Slide Ratio 16:9
- Color
Keywords
- #Content-Based Slides
- #Design-Based Slides
- #Market and Competitor Analysis
- #Graph
- #Competitor Analysis
- #Market Analysis
- #Horizontal Bar
- #Segmented Horizontal Bar
- #16:9
- #horizontal bar chart PowerPoint
- #year-over-year comparison slides
- #competitive analysis template
- #market analysis graph PowerPoint
- #bar graph presentation template download
About the Product
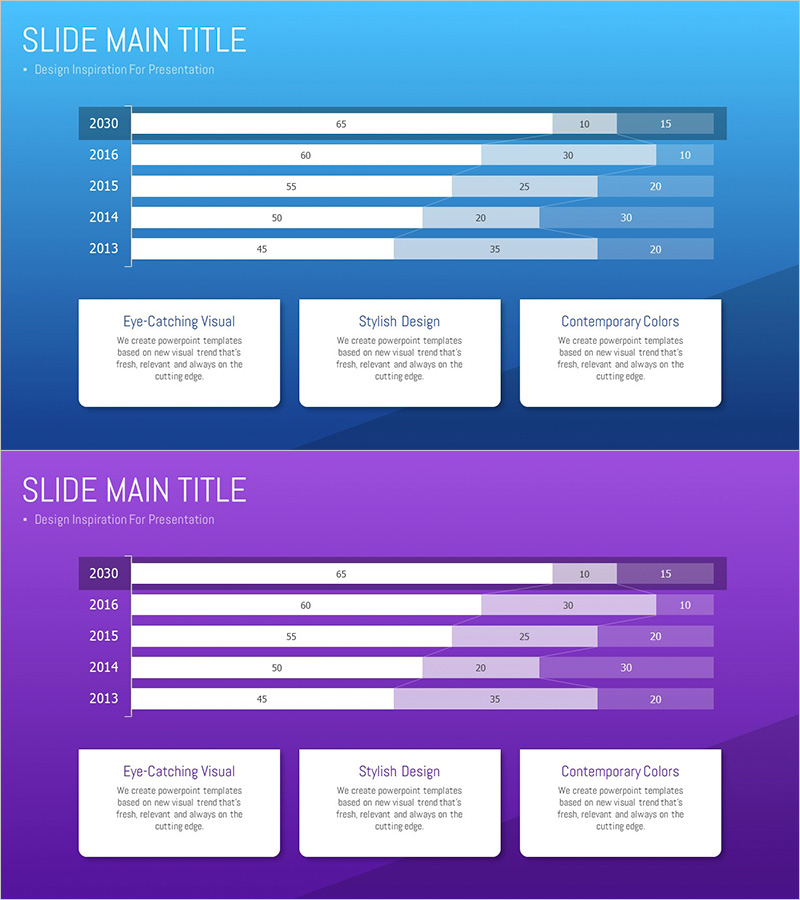
A PowerPoint slide visualizing annual market data through a 5-year horizontal bar chart comparing competitive positioning. The chart displays data from 2030 to 2013 across three data series (primary metric, secondary metric, additional metric) with distinct color differentiation. Set against a bright blue background with white bars and gray-toned series, the chart enables clear data comparison. This PPT template is ideal for executive reports, business analysis presentations, marketing strategy briefings, and competitive landscape assessments.
Usage Points
-
Main Usage
This slide compares competitive positioning metrics across five years using a horizontal bar chart format. It simultaneously displays three data series across five annual periods, enabling intuitive visualization of competitive advantage trends over time. Suitable for executive reports, business analysis presentations, market strategy briefings, and performance benchmarking.
-
How to Use
Edit the bar lengths, numerical values, and labels directly with your own data for immediate use. Customize year labels, data values, and series colors to adapt the template to various comparative analysis scenarios. Apply to executive meetings, investor presentations, internal performance reviews, and strategic planning sessions.
-
Recommended For
Recommended for executives, business analysts, marketing managers, financial analysts, and consultants preparing competitive analysis and performance comparison materials. Particularly suited for year-over-year trend analysis, competitive benchmarking, market share comparisons, departmental performance evaluations, and strategic positioning assessments.
-
Slide Structure
Two-slide set featuring 5-year horizontal bar charts (2030, 2016, 2015, 2014, 2013). Each year displays three color-coded data series with numerical values at bar endpoints. Blue background with white text and gray-toned bars ensures optimal data readability and visual clarity.
Related Products
-

Market Analysis Graph Ahead of the Future – Innovative Business Insights
#Market and Competitor Analysis #Diagram #Graph
-

Segmented Bar Graph for Market and Competitor Analysis
#Market and Competitor Analysis #Graph #Competitor Analysis
-

Business Service Analysis Segmentation Graph – Ideal for Market and Competitor Analysis
#Market and Competitor Analysis #Graph #Competitor Analysis
-

Blue Green Subdivided Graph – Template for Market and Competitor Analysis
#Market and Competitor Analysis #Graph #Competitor Analysis
