Business Partner Analysis Bar Graph – Market Insights
RJ0300087_14
- Last Update 05/13/2025
- File Size 0.1MB
- # of Slides 2
- File Format PPTX
- Slide Ratio 16:9
- Color
Keywords
- #Content-Based Slides
- #Design-Based Slides
- #Market and Competitor Analysis
- #Graph
- #Competitor Analysis
- #Market Analysis
- #Horizontal Bar
- #Segmented Horizontal Bar
- #16:9
- #horizontal bar chart PowerPoint
- #year-over-year comparison slide
- #3-series data visualization
- #business analysis template
- #bar graph PowerPoint download
About the Product
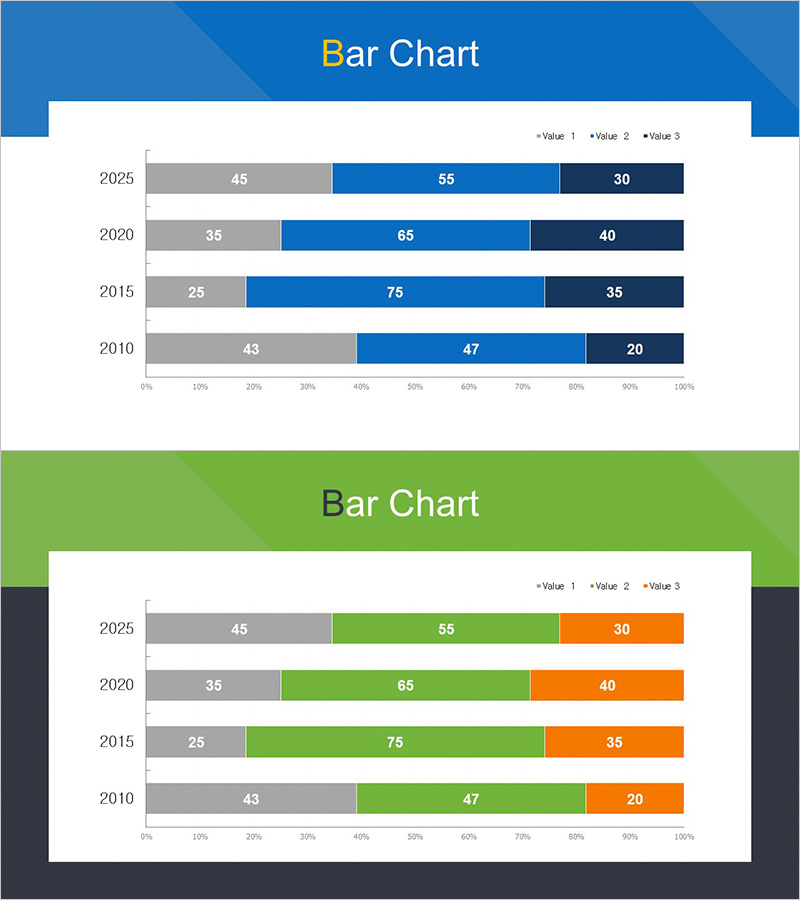
A horizontal bar chart PowerPoint slide comparing business performance across three data series by year. This template visualizes data from 2010 to 2025 with four years displayed, each showing three values (Value 1, 2, and 3) side by side to illustrate trends and changes. The multi-color palette—blue, green, orange, and gray—makes it ideal for market analysis, competitive benchmarking, partner performance evaluation, and business insights presentations. The 16:9 widescreen format with 2-slide layout integrates seamlessly into the data section of your presentation.
Usage Points
-
Main Usage
Displays four years of data (2010–2025) across three series using horizontal bars arranged side by side, enabling quick comparison of values by year and series while revealing trends. Suitable for business partner performance, market share analysis, competitive benchmarking, departmental results, and other quantitative business comparisons.
-
How to Use
Insert into business reports, investor presentations, marketing plans, and executive briefings in the data comparison section. Replace the numeric values with your actual data and update the legend labels (Value 1, 2, 3) to match your categories. Color customization is straightforward for brand alignment.
-
Recommended For
Executives, marketing managers, sales analysts, consultants, and financial analysts presenting quantitative comparisons and trend analysis. Particularly effective when demonstrating year-over-year changes or simultaneous comparison of multiple metrics in business presentations.
-
Slide Structure
2-slide set. Slide 1 features a blue background with white title and three-color horizontal bars (gray, blue, dark blue) across four rows (2025, 2020, 2015, 2010). Slide 2 uses a green background with the same data rendered in green and orange tones. Each bar includes numeric labels, legend, and 0–100% horizontal axis.
Related Products
-

Business Service Analysis Segmentation Graph – Ideal for Market and Competitor Analysis
#Market and Competitor Analysis #Graph #Competitor Analysis
-

Segmented Bar Graph for Market and Competitor Analysis
#Market and Competitor Analysis #Graph #Competitor Analysis
-

Chemical Experiment Analysis Horizontal Bar Graph
#Market and Competitor Analysis #Graph #Competitor Analysis
-

Financial Management Analysis Detailed Graph
#Market and Competitor Analysis #Graph #Competitor Analysis
