Aging Process Diagram – Visualizing Stages of Change
RJ0400032_18
- Last Update 05/26/2025
- File Size 8.9MB
- # of Slides 2
- File Format PPTX
- Slide Ratio 16:9
- Color
Keywords
- #Content-Based Slides
- #Design-Based Slides
- #Business Strategy
- #Business Management
- #Diagram
- #Other
- #Step-by-Step Schedule Plan
- #Execution Plan
- #Flow
- #Linear Flow
- #16:9
- #4-stage diagram PowerPoint
- #linear process timeline slide
- #aging progression visualization
- #sequential change diagram
- #project timeline PPT slide
About the Product
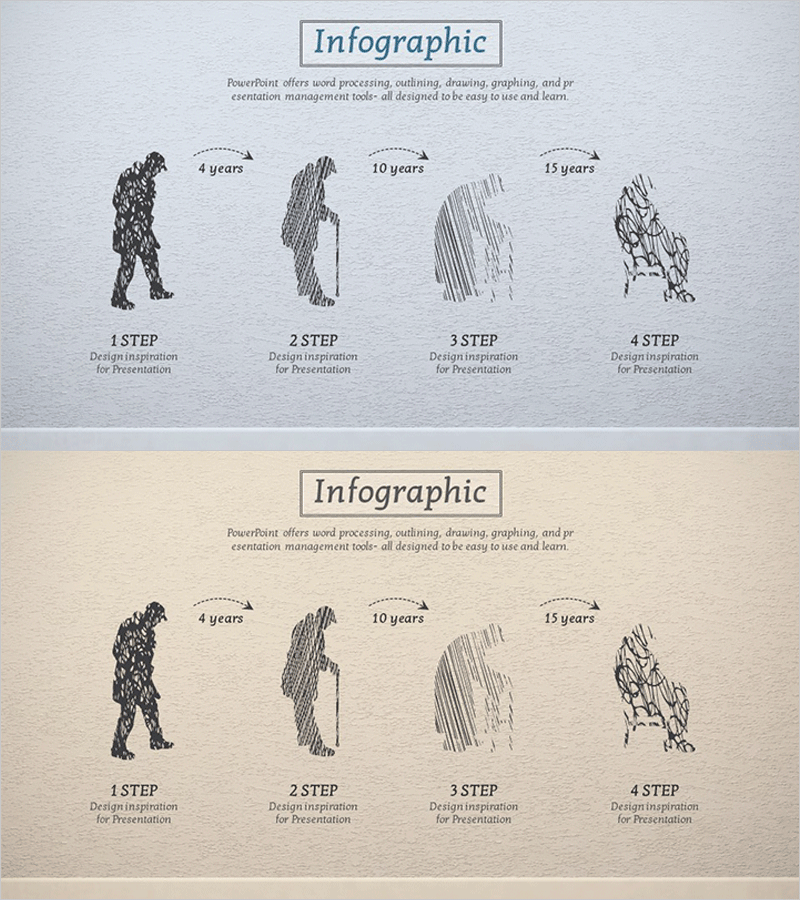
A linear diagram PowerPoint slide that visualizes a four-stage progression over time using silhouette figures and timeline markers. The design features black silhouette images of human figures at different stages, dotted arrow connectors, and year labels (4 years, 10 years, 15 years) to clearly show sequential development. This 2-slide PPTX template in 16:9 format is ready to use for business management, project timelines, organizational change, talent development, and lifecycle presentations. Each stage includes a text input area for customization, and the neutral gray background adapts to various presentation topics and corporate branding.
Usage Points
-
Main Usage
Presents time-based processes, project phases, organizational transformations, and talent development journeys across four sequential stages. The explicit time intervals (4 years → 10 years → 15 years) effectively communicate long-term planning, growth trajectories, and milestone achievements to stakeholders.
-
How to Use
Enter project names, milestones, or performance metrics into each stage's text area. Replace silhouette images with team members, product iterations, or technology evolution as needed. Maintain the arrow connectors and year labels, but customize colors to match your corporate brand for visual consistency throughout the presentation.
-
Recommended For
Ideal for executives, project managers, HR professionals, and marketing teams presenting medium to long-term strategies, organizational restructuring, product roadmaps, and talent pipeline development. Also effective for educational seminars, consulting presentations, and training programs explaining learning progressions and change management.
-
Slide Structure
Two-slide layout with four silhouette nodes, three dotted arrow connectors, and four timeline labels (4 years, 10 years, 15 years, final stage). Gray background with black silhouettes and text. Each stage features a 'Design inspiration for Presentation' text input area for easy customization and content integration.
Related Products
-

Stretching After Working Out – Health and Vitality
#Business Strategy #Diagram #Other
-

Silhouette Layer Diagram – Visualizing Business Strategy
#Business Strategy #Business Management #Diagram
-

Sports Flow Strategy Diagram – Step-by-Step Business Plan
#Business Strategy #Business Management #Diagram
-

Activity Plan Sequence Diagram – Business Strategy Visualization
#Business Strategy #Business Management #Diagram
