Flow Diagram for Key Takeaway Summary
RM0800008_13
- Last Update 10/05/2025
- File Size 0.4MB
- # of Slides 2
- File Format PPTX
- Slide Ratio 16:9
- Color
Keywords
- #Content-Based Slides
- #Design-Based Slides
- #Business Strategy
- #Business Management
- #Diagram
- #Step-by-Step Schedule Plan
- #Execution Plan
- #Flow
- #Cluster
- #Linear Flow
- #Chain Diagram
- #16:9
- #circular flow diagram PowerPoint
- #5-step process flow slide
- #cycle diagram template
- #how to create flow diagram in PowerPoint
- #process visualization slide download
About the Product
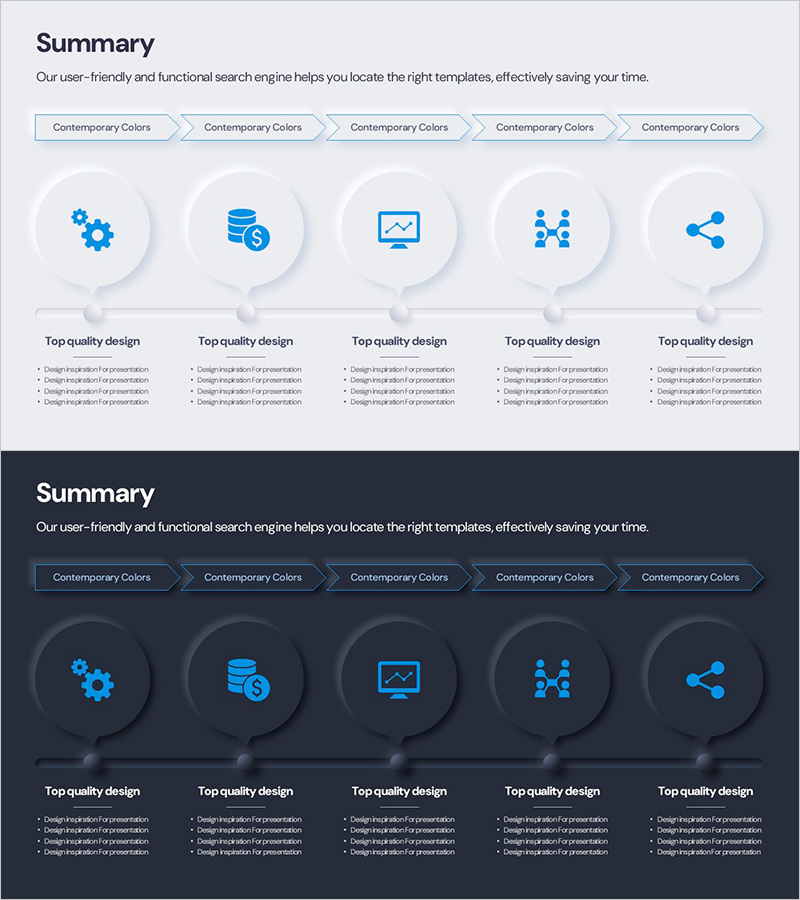
A 5-step circular flow diagram PowerPoint slide that visualizes key concepts and processes in a sequential cycle. Five nodes connected by arrows form a continuous loop, with each step featuring blue icons and dedicated text areas for clear process communication. The light gray background contrasts with blue accent colors and icons, ensuring strong visual impact. Provided in two versions—light and dark themes—across 2 slides, making it immediately applicable to business plans, operational processes, and strategic roadmaps.
Usage Points
-
Main Usage
Communicate business cycles, operational workflows, product development stages, marketing funnels, and customer journeys by breaking down circular processes into five distinct steps. The combination of icons and text transforms abstract concepts into concrete, easy-to-understand visuals that resonate with diverse audiences.
-
How to Use
Enter step names, descriptions, responsibilities, and timelines into each node's text area to create a customized flow diagram. Select the light theme for bright-background presentations and printing, or the dark theme for large-screen displays in dimly lit environments. Colors, icons, and arrows are fully editable to match your brand.
-
Recommended For
Business strategists, project managers, marketing professionals, operations managers, and educators who need to explain step-by-step plans, process improvements, and cyclical workflows. Ideal for business proposals, operational reports, strategic presentations, and training materials.
-
Slide Structure
Five circular nodes connected by directional arrows in a continuous loop. Each node contains a blue icon and text input area. Light gray background version (top) and dark navy background version (bottom) provided. 16:9 aspect ratio, PPTX format, 2 slides total.
Related Products
-

Step by Step Plan Linear Diagram – Effective Business Strategy
#Business Strategy #Business Management #Diagram
-

Activity Plan Sequence Diagram – Business Strategy Visualization
#Business Strategy #Business Management #Diagram
-

Business Stage Execution Plan PPT – Effective Execution Strategy STEP5
#Business Strategy #Business Management #Diagram
-

Activity Plan Arrow Linear Diagram – Business Strategy
#Business Strategy #Business Management #Diagram
