Flow Diagram and Table – Visualizing Business Strategy
RJ0600039_32
- Last Update 07/01/2025
- File Size 2.7MB
- # of Slides 2
- File Format PPTX
- Slide Ratio 16:9
- Color
Keywords
- #Content-Based Slides
- #Design-Based Slides
- #Business Strategy
- #Business Management
- #Diagram
- #Step-by-Step Schedule Plan
- #Execution Plan
- #Flow
- #Table
- #Linear Flow
- #16:9
- #linear flow diagram PowerPoint
- #4-step process slide template
- #business strategy visualization
- #process flow diagram PPT
- #step-by-step flowchart PowerPoint
About the Product
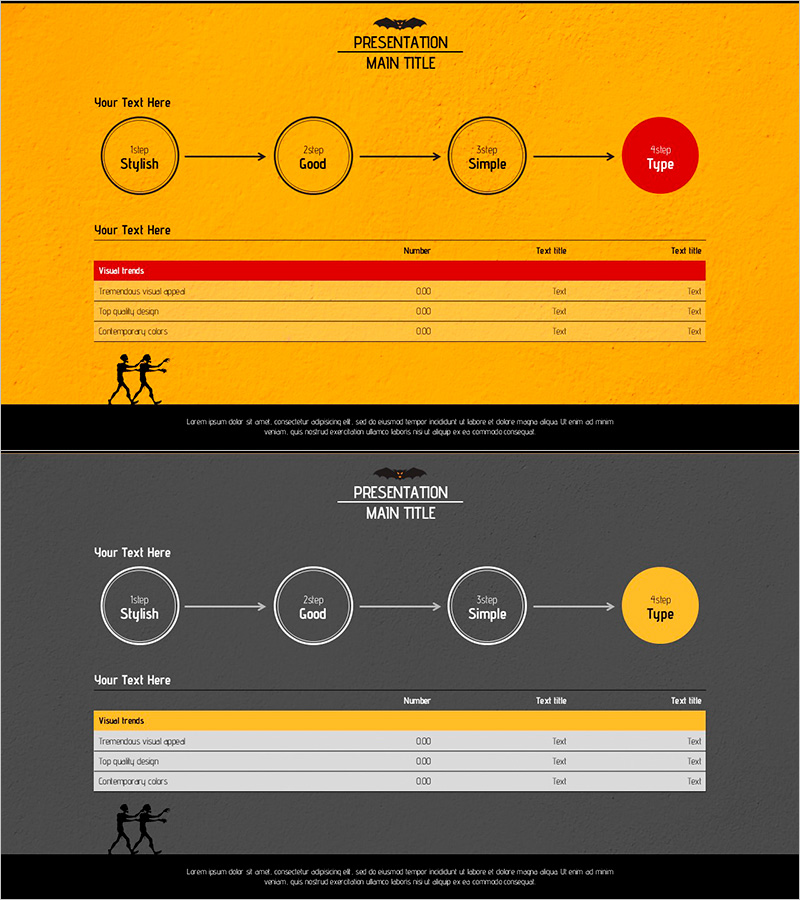
A PowerPoint slide featuring a 4-node linear flow diagram paired with a comparison table for comprehensive process visualization. The design uses an orange background with circular nodes connected by directional arrows, with the final node highlighted in red for emphasis. The accompanying table below allows you to input numerical data and descriptions for each stage, making it ideal for business strategy roadmaps, product development phases, marketing campaign timelines, and organizational change management. Two slide layouts are included: a bright orange version and a dark gray version for flexible presentation design.
Usage Points
-
Main Usage
Designed to visualize sequential business processes such as strategy implementation phases, product development cycles, marketing campaign progression, and organizational transformation. The combination of visual flow diagram and data table enables simultaneous presentation of stage characteristics and key performance metrics.
-
How to Use
Enter stage names in the four circular nodes and populate the table below with corresponding metrics, titles, and descriptions. Node colors, sizes, and arrow styles are fully editable. Background colors can be customized to match your corporate branding or presentation theme.
-
Recommended For
Ideal for executives, project managers, marketing professionals, and strategic planning teams presenting business plans, quarterly reports, and strategy presentations. Particularly effective when communicating both process progression and performance indicators to stakeholders.
-
Slide Structure
Slide 1: Orange background with 4 circular nodes (Stylish→Good→Simple→Type) connected by arrows, 3-row data table below (Visual trends, Tremendous visual aspect, Top quality design, Contemporary colors). Slide 2: Dark gray background with identical structure, white-bordered nodes, orange-highlighted final node. 16:9 aspect ratio, PPTX format.
Related Products
-

Basic Physical Exercise Sequence – Simple Step-by-Step Activities
#Business Strategy #Business Management #Diagram
-

Introduction to the Filming Location Schedule – Step-by-Step Flow
#Business Strategy #Business Management #Diagram
-

Flow Diagram for Key Takeaway Summary
#Business Strategy #Business Management #Diagram
-

4 STEP Quality Assurance Plan Slide
#Business Strategy #Business Management #Diagram
