Comparative Analysis of Sales of Camping Competitors – Insights and Comparisons
RJ0600032_27
- Last Update 06/29/2025
- File Size 1.2MB
- # of Slides 2
- File Format PPTX
- Slide Ratio 16:9
- Color
Keywords
- #Content-Based Slides
- #Design-Based Slides
- #Market and Competitor Analysis
- #Graph
- #Competitor Analysis
- #Competitive Advantage
- #Horizontal Bar
- #Double Horizontal Bar
- #16:9
- #dual-axis bar chart PowerPoint
- #comparative analysis slide template
- #competitor analysis chart
- #sales comparison graph
- #how to create bar chart in PowerPoint
About the Product
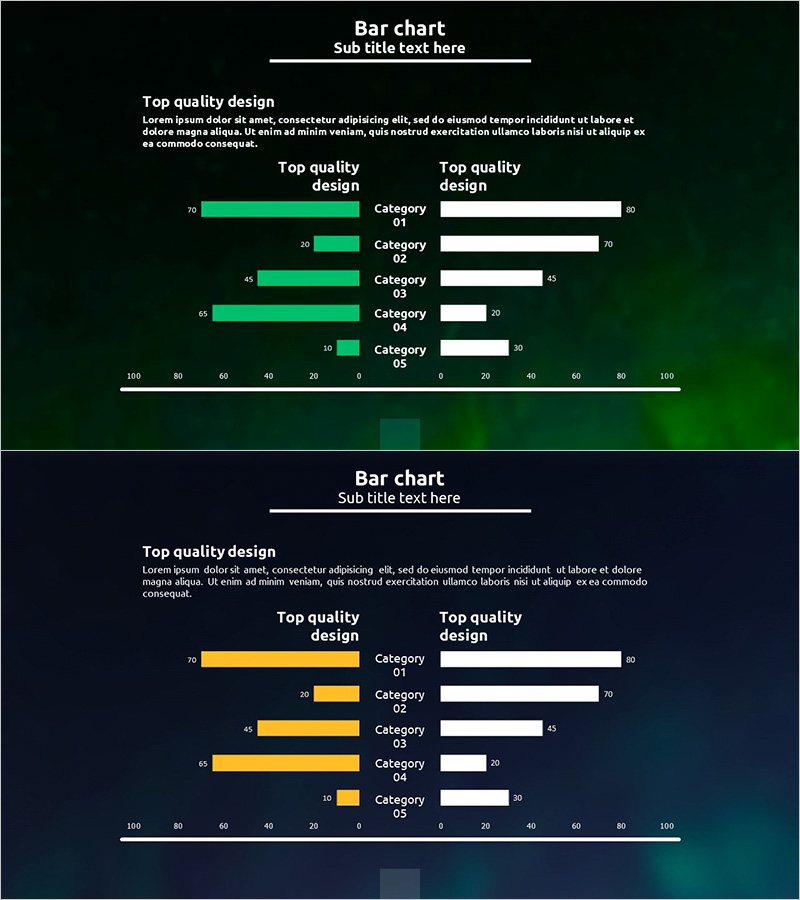
A dual-axis bar chart PowerPoint slide designed for competitive sales analysis in the camping market. This presentation template features a side-by-side comparison structure with green bars on the left and white bars on the right, enabling clear visualization of two data series across five categories. The PPTX file contains 2 slides in 16:9 aspect ratio, each with title, subtitle, descriptive text areas, and dedicated data visualization zones. Ideal for business presentations including competitor analysis, sales comparison, market share assessment, and strategic insights that require immediate deployment.
Usage Points
-
Main Usage
Visualize two-series data in a side-by-side contrast structure to communicate competitive sales gaps, market share distribution, and performance comparisons. The five-category breakdown provides clear numerical evidence for strategic decision-making and stakeholder communication.
-
How to Use
Deploy in competitive analysis reports, market research presentations, quarterly performance review meetings, and investor pitch decks to objectively present competitive landscape data. Simply edit the bar values and category labels to input your actual data for immediate presentation-ready output.
-
Recommended For
Marketing managers, executives, business development teams, consultants, and analysts conducting competitor benchmarking, market analysis, and performance comparison presentations. Applicable across camping, leisure, consumer goods, retail, and other industries requiring comparative data visualization.
-
Slide Structure
Two-slide set with each slide containing title, subtitle, and descriptive text areas alongside a dual-axis bar chart. The chart displays five categories (Category 01–05) with green bars on the left axis and white bars on the right axis, each labeled with numerical values for precise data representation.
Related Products
-

Bar Graph Comparing Exercise Performance by Group
#Market and Competitor Analysis #Graph #Competitor Analysis
-

Horizontal Bar Graph for Cooking Competition
#Market and Competitor Analysis #Graph #Competitor Analysis
-

Competitor Analysis Thin Bar Graph – Visualizing Market Competitive Advantage
#Market and Competitor Analysis #Graph #Competitor Analysis
-

Competitor Paired Bar Graph – Market Analysis and Comparison
#Market and Competitor Analysis #Graph #Competitor Analysis
