Line Graph for Comparative Analysis – Highlighting Competitive Advantage
RJ0300084_25
- Last Update 05/12/2025
- File Size 0.1MB
- # of Slides 2
- File Format PPTX
- Slide Ratio 16:9
- Color
Keywords
About the Product
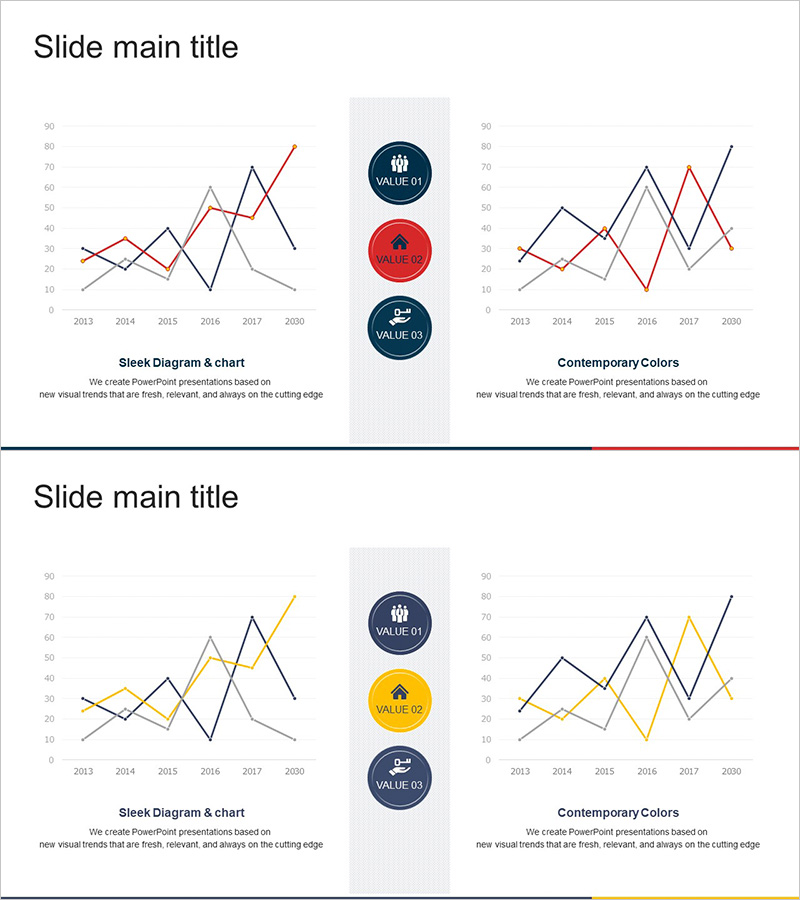
A multi-series line chart PowerPoint slide designed for competitive analysis and market trend visualization. This template displays data changes from 2013 to 2020 across three distinct series, enabling you to emphasize competitive advantage through side-by-side comparison. Navy, red, and gray color schemes clearly differentiate each series, while the dual-layout structure combines a left-side line graph with a right-side comparative chart. VALUE badges highlight key metrics, making this slide ready for immediate use in business reports, proposals, and executive presentations.
Usage Points
-
Main Usage
Compare competitor performance and market trends simultaneously across multiple series to demonstrate your company's competitive advantage with data-driven evidence. Clearly visualize changes over time to deliver credible analysis results to executives, investors, and clients.
-
How to Use
Input actual data into the left-side line graph; the right-side comparative chart updates automatically. Modify VALUE badge text to reflect your key metrics and adjust color schemes to match brand guidelines. Place this slide in market analysis sections of reports, competitive analysis in proposals, or trend discussions in executive presentations.
-
Recommended For
Marketing managers, executives, strategy planners, and sales leaders presenting competitor benchmarking, market share evolution, and revenue trend comparisons. Ideal for quarterly performance reports, investment pitch decks, business proposals, and consulting reports requiring multi-data comparison.
-
Slide Structure
2-slide set: Slide 1 features a 3-series line graph (2013-2020, Y-axis 0-90) with three centered VALUE badges and a right-side comparative chart in dual-layout format. Slide 2 offers the same structure with alternate color scheme (navy, yellow, gray). 16:9 widescreen format optimized for projectors and monitors.
Related Products
-

Neon Tone Competitor Analysis Broken Line Graph
#Market and Competitor Analysis #Graph #Competitor Analysis
-

Competition Graphs and Analysis – Slides for Market Advantage
#Market and Competitor Analysis #Graph #Competitor Analysis
-

Broken Line Comparison Graph – Optimized for Market and Competitor Analysis
#Market and Competitor Analysis #Graph #Competitor Analysis
-

Blue Green Broken Line Graph – Competitor Analysis
#Market and Competitor Analysis #Graph #Competitor Analysis
