Business City Background Occupancy Graph
RJ0300059_10
- Last Update 05/04/2025
- File Size 3.3MB
- # of Slides 2
- File Format PPTX
- Slide Ratio 16:9
- Color
Keywords
- #Content-Based Slides
- #Design-Based Slides
- #Product/Service Introduction
- #Market and Competitor Analysis
- #Graph
- #Development Status
- #Market Share
- #Circles
- #Pie Chart
- #16:9
- #pie chart PowerPoint slide
- #3-segment pie chart template
- #business data visualization PPT
- #market share graph slide
- #ratio representation template
About the Product
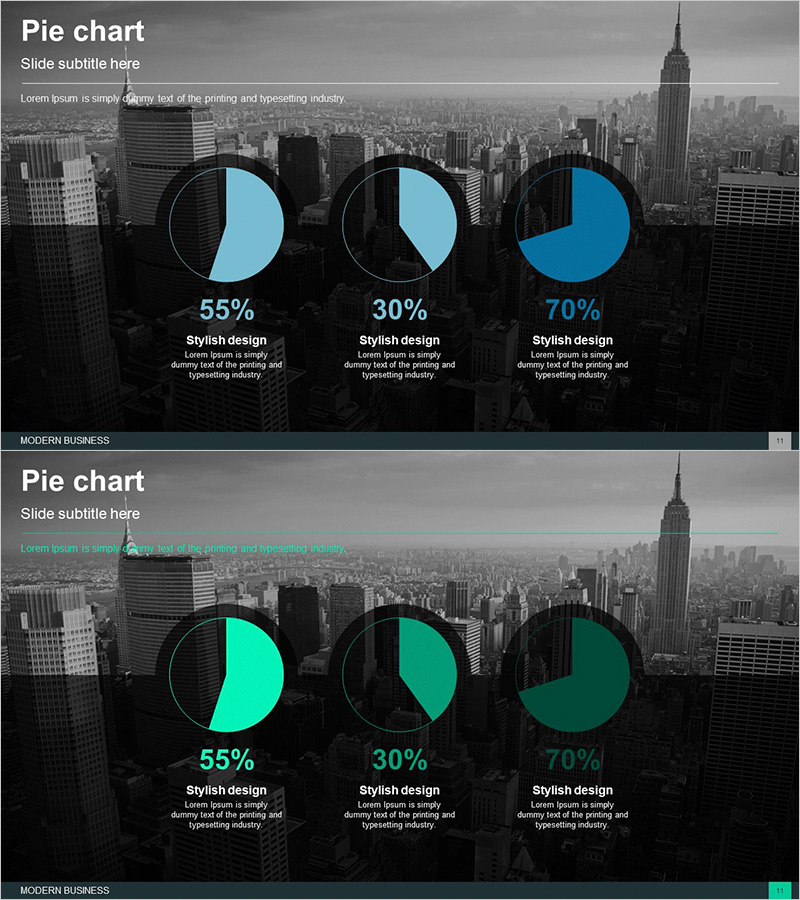
A professional PowerPoint slide featuring three pie charts set against an urban skyline background. The design uses teal and black tones to emphasize data visualization, with percentage values and descriptive text areas beneath each chart. The 2-slide set includes both teal and green color variants, allowing you to select the version that best matches your presentation theme and brand colors. Ideal for communicating business data such as market share, sales ratios, customer demographics, and budget allocation in a clear, visually engaging format.
Usage Points
-
Main Usage
Designed to visually represent proportions and percentages such as market share, sales distribution, customer composition, and budget allocation. The combination of urban background and data charts adds professionalism and credibility to business presentations.
-
How to Use
Edit the percentage values and text labels beneath each pie chart to input your actual data. The city background remains fixed, while chart colors and data labels can be customized as needed. Choose between the teal or green color variant based on your presentation theme and brand guidelines.
-
Recommended For
Recommended for marketing managers, sales directors, financial analysts, and executives preparing business reports. Suitable for quarterly performance reviews, market analysis presentations, investor pitch decks, and business proposals that require data-driven decision support.
-
Slide Structure
Each slide contains three independent pie charts, with each chart divided into 2-3 segments. Percentage values and text description areas are positioned below each chart, while title and subtitle areas are located at the top. The 16:9 widescreen format is optimized for modern presentation environments and digital displays.
Related Products
-

Pie Chart of the Development Status of the Snow Mountain Theme
#Product/Service Introduction #Market and Competitor Analysis #Diagram
-

Pie Chart for Learning Progress – Optimizing Data Visualization
#Product/Service Introduction #Market and Competitor Analysis #Graph
-

Modern Theme Pie Chart – Market Share Analysis
#Product/Service Introduction #Market and Competitor Analysis #Graph
-

Construction Development Status Chart – Key to Construction Market Analysis
#Product/Service Introduction #Market and Competitor Analysis #Graph
