Development Status Pie Chart – Visualizing Product Progress
RJ0300024_9
- Last Update 04/24/2025
- File Size 0.3MB
- # of Slides 2
- File Format PPTX
- Slide Ratio 16:9
- Color
Keywords
- #Content-Based Slides
- #Design-Based Slides
- #Product/Service Introduction
- #Market and Competitor Analysis
- #Graph
- #Development Status
- #Market Share
- #Circles
- #Pie Chart
- #16:9
- #pie chart PowerPoint slide
- #circular graph presentation template
- #ratio visualization slide
- #development status chart
- #pie chart download
About the Product
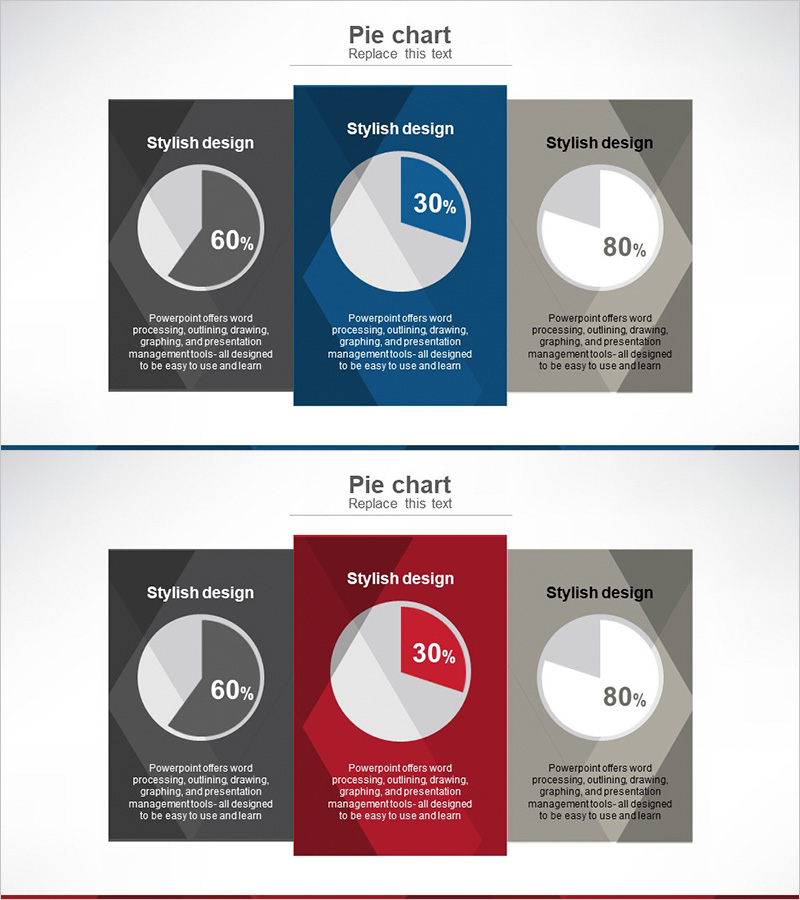
A PowerPoint slide featuring three pie charts designed to visualize product development progress, market share distribution, and competitive analysis across three segments. Available in three background color schemes—dark blue, charcoal, and beige—each chart displays different percentage data (60%, 30%, 80%) with corresponding labels and description text areas. Ideal for product presentations, business reports, and investor pitches. Formatted in 16:9 widescreen PPTX with 2 fully editable slides.
Usage Points
-
Main Usage
Communicate three-way ratio data—such as product development progress, market share distribution, or competitive positioning—in a single, visually clear layout. Each pie chart operates independently, allowing flexible representation of different percentage values across multiple comparison scenarios.
-
How to Use
Insert into product introduction sections, market analysis pages, or quarterly business review presentations to explain numerical data intuitively. Customize background colors and percentage values to match your specific data, then present with minimal additional formatting.
-
Recommended For
Product managers, marketing professionals, business development teams, investor relations specialists, and quarterly report presenters who need to communicate data-driven insights with visual clarity and impact.
-
Slide Structure
Two-slide set with three pie charts arranged horizontally (left, center, right) on each slide. Each chart is segmented into 2–3 sections with percentage labels. The center chart features a contrasting background color (dark blue or wine red) for emphasis. Description text areas positioned below each chart for context and explanation.
Related Products
-

Securities Business Analysis Circle Graph
#Product/Service Introduction #Market and Competitor Analysis #Graph
-

4 Donut Charts for Data Visualization – Easy Presentation Template
#Product/Service Introduction #Market and Competitor Analysis #Graph
-

Pie Chart for Market Share Analysis – Effective Data Visualization
#Product/Service Introduction #Market and Competitor Analysis #Graph
-

Market Share Analysis Graph & Table – Enhancing Understanding through Data Visualization
#Product/Service Introduction #Market and Competitor Analysis #Diagram
