Pie Chart for Learning Progress – Optimizing Data Visualization
RJ0500008_8
- Last Update 06/09/2025
- File Size 2.3MB
- # of Slides 2
- File Format PPTX
- Slide Ratio 16:9
- Color
Keywords
- #Content-Based Slides
- #Design-Based Slides
- #Product/Service Introduction
- #Market and Competitor Analysis
- #Graph
- #Development Status
- #Market Share
- #Circles
- #Pie Chart
- #16:9
- #pie chart PowerPoint slide
- #3-segment pie chart template
- #data ratio visualization
- #percentage chart slide
- #comparison pie chart download
- #learning progress chart
About the Product
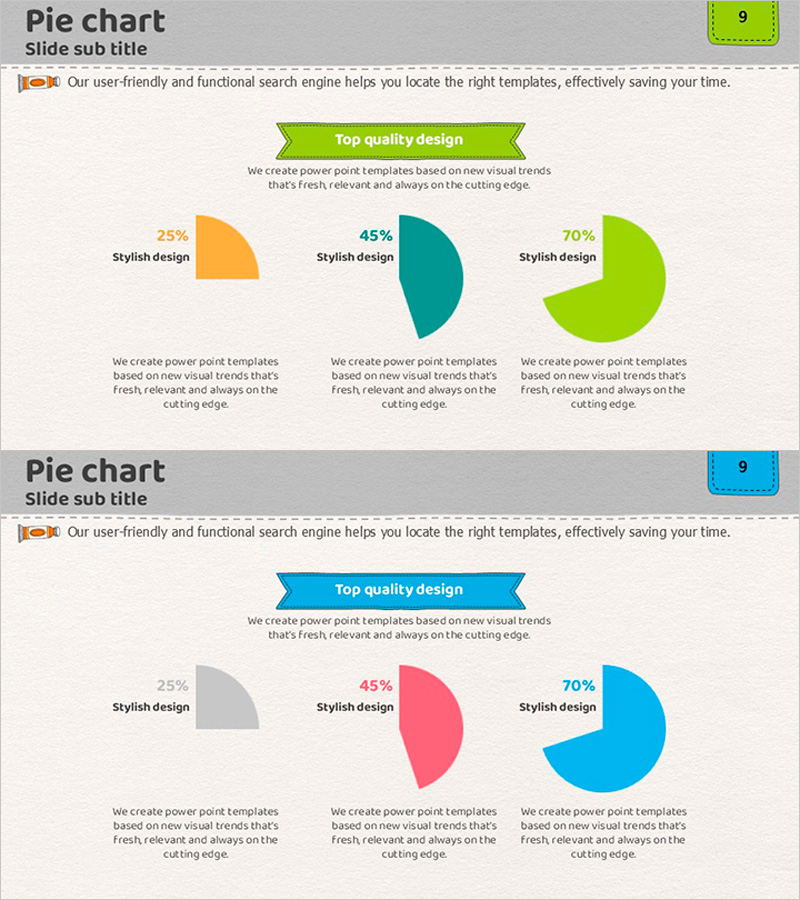
A professional pie chart PowerPoint slide designed to compare three data items side-by-side, perfect for displaying learning progress, market share, or project completion rates. Three separate pie charts in orange (25%), teal (45%), and lime (70%) are arranged horizontally, allowing simultaneous visualization of multiple datasets. Each chart includes a dedicated text area below for adding interpretations and insights. Optimized for 16:9 widescreen format with 2-slide layouts, this template is ready to use in educational materials, business reports, and marketing presentations.
Usage Points
-
Main Usage
Simultaneously compare multiple data items using pie charts to convey proportional relationships intuitively. Ideal for tracking learning progress, analyzing market share, allocating budgets, and presenting customer satisfaction surveys with ratio-based information.
-
How to Use
Replace the chart values and labels with your own data. Add interpretation or supporting details in the text area below each pie chart to enhance audience comprehension. Colors can be adjusted to match your brand guidelines.
-
Recommended For
Educational institutions' learning outcome reports, marketing teams' market analysis presentations, executive business status updates, consulting proposal data sections, academic presentations, and seminar materials.
-
Slide Structure
Slide 1: Three pie charts in orange, teal, and lime arranged horizontally with text description areas below each. Slide 2: Alternative layout with teal, pink, and blue color scheme. Both slides feature a title area, three independent pie charts, and dedicated text boxes for explanations.
Related Products
-

Development Status Pie Chart – Visualizing Product Progress
#Product/Service Introduction #Market and Competitor Analysis #Graph
-

Construction Development Status Chart – Key to Construction Market Analysis
#Product/Service Introduction #Market and Competitor Analysis #Graph
-

Market Share Analysis Graph & Table – Enhancing Understanding through Data Visualization
#Product/Service Introduction #Market and Competitor Analysis #Diagram
-

Space Illustration Theme Circle Graph
#Product/Service Introduction #Market and Competitor Analysis #Graph
