Molecular Graphics History – Business Vision and Goals
RB0800034_5
- Last Update 03/24/2025
- File Size 1.4MB
- # of Slides 2
- File Format PPTX
- Slide Ratio 4:3
- Color
Keywords
- #Content-Based Slides
- #Design-Based Slides
- #Company Introduction
- #Business Vision and Strategy
- #Diagram
- #History
- #Business Goals
- #Flow
- #Cluster
- #Linear Flow
- #Closed Cluster Diagram
- #4:3
- #hexagon diagram PowerPoint
- #timeline slide template
- #4-stage vision diagram
- #corporate history PPT
- #business evolution presentation
About the Product
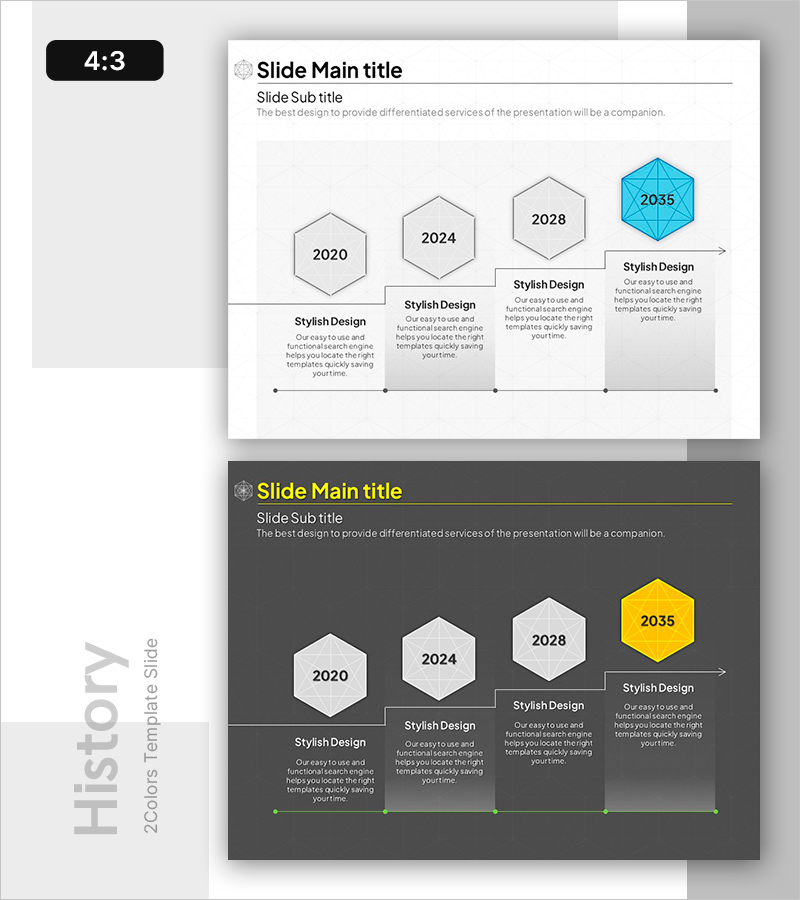
A professional PowerPoint slide featuring a hexagon timeline diagram that visualizes corporate vision and goal progression from 2020 to 2035. The design uses four hexagonal nodes arranged horizontally with connecting arrows, with the final stage highlighted in blue to emphasize future objectives. Each node includes space for descriptive text below, allowing detailed explanation of strategic milestones and achievements. This presentation template is ideal for business plans, annual reports, strategic presentations, and investor pitches.
Usage Points
-
Main Usage
This slide effectively communicates long-term corporate vision and phased goal achievement through visual representation. Four hexagonal nodes arranged chronologically emphasize progression, with the final objective highlighted in blue to convey future orientation. Ideal for executive briefings, investor relations, and organizational strategy alignment meetings.
-
How to Use
Enter years and key objectives in each hexagon node, then add strategic details and achievements in the text areas below. Customize colors to distinguish current and future phases, and adjust arrows to show cause-and-effect relationships. The 4:3 aspect ratio ensures compatibility with standard presentation environments.
-
Recommended For
Recommended for business plans, annual reports, strategic presentations, investor pitches, organizational restructuring briefings, and long-term vision communications. Particularly effective for executives and strategy leaders presenting corporate growth trajectory and future goals.
-
Slide Structure
Two-slide layout. First slide contains title and subtitle areas. Second slide features four hexagonal nodes (2020, 2024, 2028, 2035) connected by horizontal arrows in a timeline structure. Each node has a label and descriptive text box below, with the final node highlighted in blue for emphasis.
Related Products
-

Visualization of Architectural Project Vision – Value-Centric Diagram
#Business Vision and Strategy #Diagram #Business Strategy
-

Medical Business Goals History Diagram
#Company Introduction #Business Vision and Strategy #Diagram
-

4 Approaches to Solve the Problem Slide – Effective Business Strategy
#Business Vision and Strategy #Operational Plan #Diagram
-

Goal and Strategy Arrow Diagram – Clarifying Business Objectives
#Business Vision and Strategy #Operational Plan #Diagram
