Clustered Vertical Bar Graph for Market Analysis – Data Insights
RJ0300050_8
- Last Update 05/01/2025
- File Size 0.7MB
- # of Slides 2
- File Format PPTX
- Slide Ratio 16:9
- Color
Keywords
- #Content-Based Slides
- #Design-Based Slides
- #Market and Competitor Analysis
- #Graph
- #Competitor Analysis
- #Market Analysis
- #Column
- #Grouped Column
- #16:9
- #clustered vertical bar chart PowerPoint
- #data comparison slide template
- #market analysis chart
- #competitive analysis graph
- #4-series bar chart PowerPoint
About the Product
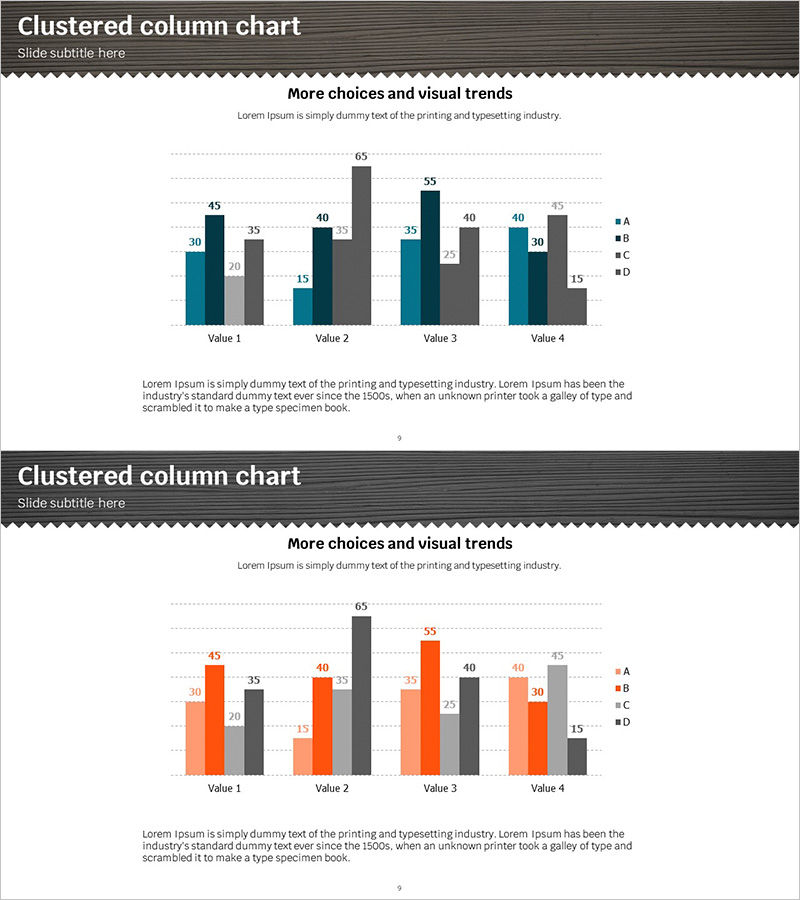
A PowerPoint slide featuring a clustered vertical bar chart that visualizes numerical data across four series. The design uses distinct color schemes—dark blue, orange, and gray tones—to clearly differentiate each series, enabling intuitive comparison of values ranging from 15 to 65 across four value groups (Value 1–4). This presentation template is ready for immediate use in market analysis, competitive benchmarking, sales performance reviews, and other business presentations where data-driven insights are essential.
Usage Points
-
Main Usage
The primary objective is to compare numerical data across four series simultaneously for multiple items (Value 1–4). This enables visualization of multi-dimensional metrics such as market size, competitor performance, quarterly results, or customer satisfaction scores, facilitating data-driven decision-making and strategic insights.
-
How to Use
Bars for each series are grouped side-by-side beneath each value label, allowing both item-to-item and series-to-series comparisons. During presentations, you can highlight specific series or items to draw audience attention, or point out peak values (such as Value 2's 65) and troughs to emphasize key findings.
-
Recommended For
Ideal for quarterly performance reviews by marketing, sales, and strategy teams; executive reports; investor presentations; and consulting proposals. Particularly effective when comparing performance across multiple products, regions, or customer segments. Suitable for any business presentation requiring data-driven decision support and multi-variable analysis.
-
Slide Structure
Two-slide set with the first slide displaying dark blue, orange, gray, and black series bars, and the second slide presenting an orange and gray color variation. Both slides show four value groups with data points ranging from 15 to 65, supported by legend and gridlines for easy numerical interpretation.
Related Products
-

Market Competitor Analysis with Clustered Vertical Bar Chart
#Market and Competitor Analysis #Graph #Competitor Analysis
-

Grouped Bar Chart for Learning Categories
#Market and Competitor Analysis #Graph #Competitor Analysis
-

Comparative Analysis Vertical Chart – Market and Competitor Analysis
#Market and Competitor Analysis #Graph #Competitor Analysis
-

Pill Market Analysis Vertical Bar Graph – Clear Visualization of Market Status
#Market and Competitor Analysis #Graph #Competitor Analysis
