Camping Competitor Characteristic Analysis Pentagon Graph
RJ0600078_11
- Last Update 07/11/2025
- File Size 0.4MB
- # of Slides 2
- File Format PPTX
- Slide Ratio 16:9
- Color
Keywords
- #Content-Based Slides
- #Design-Based Slides
- #Market and Competitor Analysis
- #Diagram
- #Graph
- #Customer Analysis
- #Competitor Analysis
- #Table
- #Other
- #Standard Table
- #Radar Chart Spider Chart
- #16:9
- #pentagon chart PowerPoint
- #radial diagram template
- #competitor analysis slide
- #5-axis comparison chart
- #PowerPoint graph slide template
About the Product
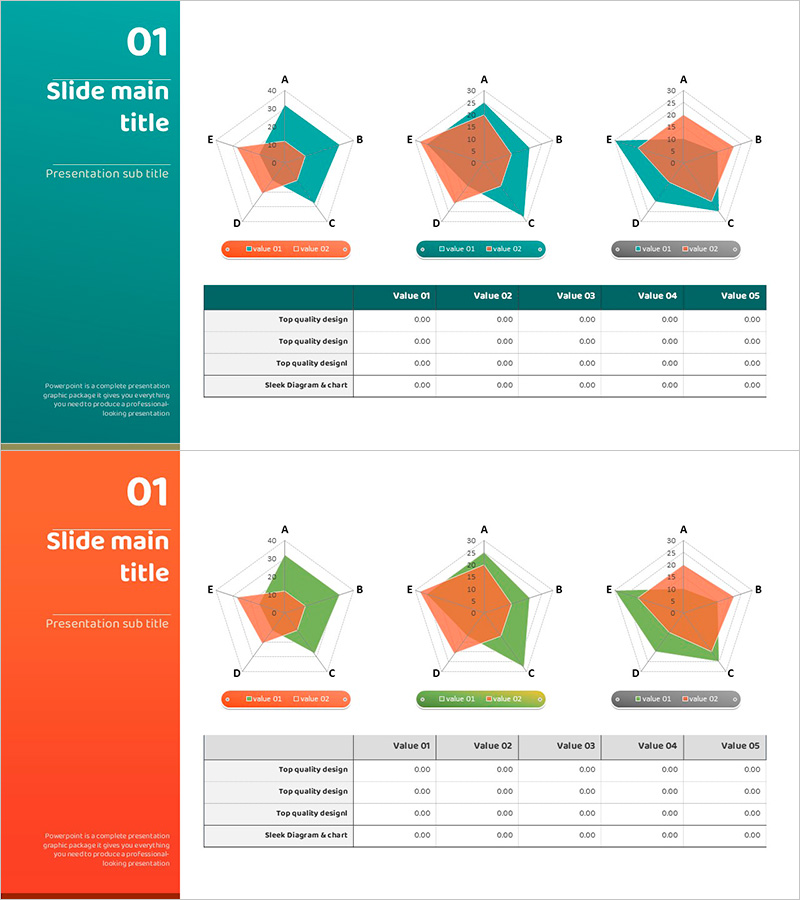
A PowerPoint slide deck featuring pentagon radial charts optimized for camping industry competitor analysis. The 5-axis design (A, B, C, D, E) enables side-by-side comparison of competitor characteristics with orange and teal dual-tone color scheme for visual contrast. Each slide displays three pentagon graphs, allowing simultaneous analysis of multiple competitors or temporal trend visualization. Integrated data table below supports numerical decision-making. The 16:9 widescreen format with 2-slide composition is ready for immediate presentation use and fully editable.
Usage Points
-
Main Usage
Visualize competitor analysis across 5 evaluation dimensions using radial pentagon geometry to identify strengths and weaknesses at a glance. Supports marketing strategy development, product positioning, and market entry planning with data-driven decision-making foundation.
-
How to Use
Input evaluation criteria names (price, quality, delivery, customer satisfaction, brand awareness, etc.) on each axis (A–E) and enter competitor scores on 0–50 scale. Assign orange fill for your company and teal for competitors to enable overlay comparison. Populate data table below with detailed metrics for presentation reference.
-
Recommended For
Marketing team competitor analysis reports, strategy planning presentations, sales proposal materials, executive briefing decks. Applicable across camping, leisure, tourism, consumer goods, B2B manufacturing, and service industries requiring competitive positioning.
-
Slide Structure
Slide 1: Left teal title area + right 3 pentagon radial charts (orange, teal, gray series) + bottom data table (5 columns). Slide 2: identical layout. Each chart includes 5-axis labels, 0–50 scale markers, and legend buttons (Choice 01/02).
Related Products
-

Trends in Youth Reading in Autumn
#Market and Competitor Analysis #Diagram #Market Status
-

Contact Customer Checklist Slide – Customer Analysis and Market Understanding
#Product/Service Introduction #Business Management #Market and Competitor Analysis
-

Performance Analysis Table Slide – Market and Competitor Analysis
#Market and Competitor Analysis #Diagram #Graph
-

Space Exploration Theme Radial Graph & Table – Perfect Choice for Data Analysis
#Technical Approach #Diagram #Graph
