Radar Charts and Tables – Market Analysis and Comparison
RJ0800020_9
- Last Update 08/05/2025
- File Size 0.2MB
- # of Slides 2
- File Format PPTX
- Slide Ratio 16:9
- Color
Keywords
- #Content-Based Slides
- #Design-Based Slides
- #Product/Service Introduction
- #Market and Competitor Analysis
- #Diagram
- #Graph
- #Composition
- #Market Status
- #Table
- #Other
- #Standard Table
- #Radar Chart Spider Chart
- #16:9
- #radial radar chart PowerPoint
- #radar chart slide template
- #market analysis chart PPT
- #competitor comparison diagram
- #5-axis radar chart
- #data visualization slides
- #performance evaluation PowerPoint template
About the Product
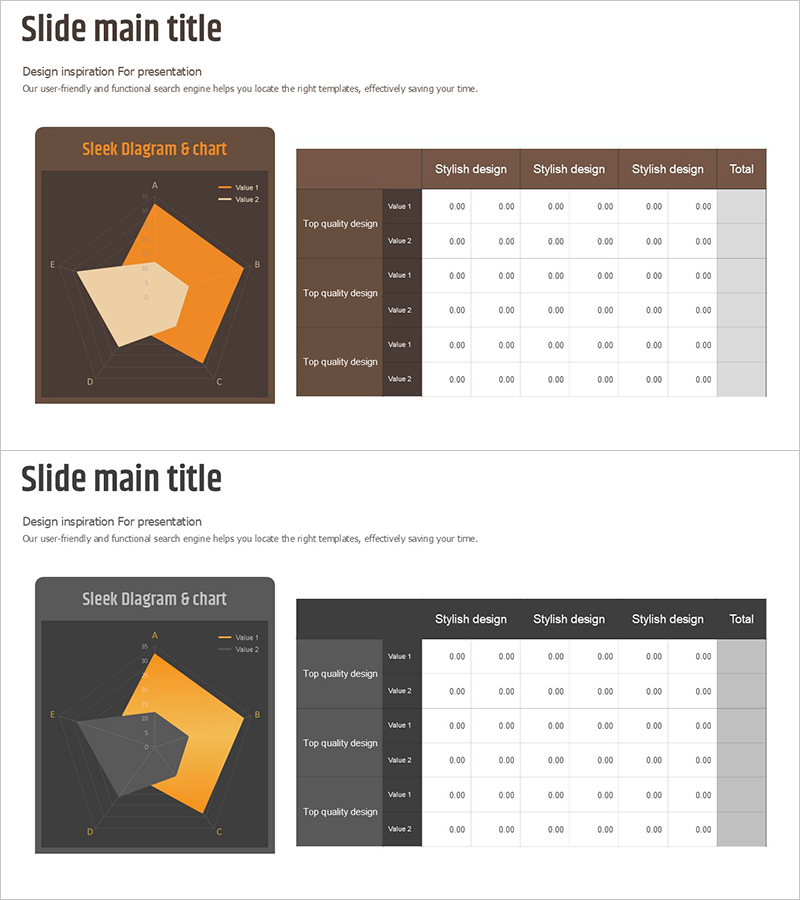
A professional PowerPoint slide featuring a 5-axis radial radar chart combined with a data table for comprehensive market analysis and competitive benchmarking. The dark brown background with orange and beige data series allows clear visualization of two datasets simultaneously, while the accompanying table on the right provides detailed numerical values. This radar chart slide template is ready to use for business presentations, market analysis reports, competitive positioning, and organizational performance evaluations. Provided in 16:9 format with 2 slides, fully editable colors and data values for customization.
Usage Points
-
Main Usage
Radial radar charts excel at comparing multiple dimensions simultaneously and visually highlighting strengths and weaknesses across categories. This slide template is optimized for market analysis presentations where competitive performance comparison, organizational capability assessment, and product characteristic analysis are required. The accompanying data table reinforces quantitative credibility by displaying precise numerical values alongside the visual representation.
-
How to Use
Integrate this slide into business presentations during market analysis or competitive strategy sections. Present the first slide with the radar chart to establish the overall comparison framework, then use the second slide with the detailed table to provide supporting numerical evidence. This two-step approach enhances audience comprehension and decision-making confidence. Simply input your actual data values to reflect real analysis results.
-
Recommended For
Ideal for executives, strategy teams, marketing departments, and sales teams preparing market analysis reports, business plans, and investor pitch decks. Also suitable for internal performance evaluations, team capability assessments, product positioning analysis, and data-driven organizational decision-making across various business contexts.
-
Slide Structure
Two-slide composition, each containing one 5-axis radial radar chart and one data table. The chart displays two data series (Value 1 and Value 2) distinguished by color, while the table organizes numerical values across three categories in a matrix format, enabling precise multi-dimensional comparison.
Related Products
-

Touch Wide Slide Template – Column Chart & Table
#Market and Competitor Analysis #Diagram #Graph
-

Child Traffic Education Implementation Table – Market Analysis and Execution Plan
#Market and Competitor Analysis #Diagram #Market Status
-

Businessperson Work Ability Analysis Graph – Successful Ability Assessment
#Product/Service Introduction #Market and Competitor Analysis #Diagram
-

Data Analysis Radial Graph for Performance Visualization – Trust and Professionalism
#Product/Service Introduction #Business Introduction #Diagram
