Market Segmentation Analysis Radial Graph – Reliable Data Visualization
RM0400015_7
- Last Update 02/19/2025
- File Size 0.4MB
- # of Slides 2
- File Format PPTX
- Slide Ratio 16:9
- Color
Keywords
- #Content-Based Slides
- #Design-Based Slides
- #Business Introduction
- #Market and Competitor Analysis
- #Diagram
- #Graph
- #Business Areas
- #Market Overview
- #Table
- #Other
- #Standard Table
- #Radar Chart Spider Chart
- #16:9
- #radial graph PowerPoint
- #market segmentation slide
- #data visualization template
- #radial diagram PPT
- #market analysis presentation slide
About the Product
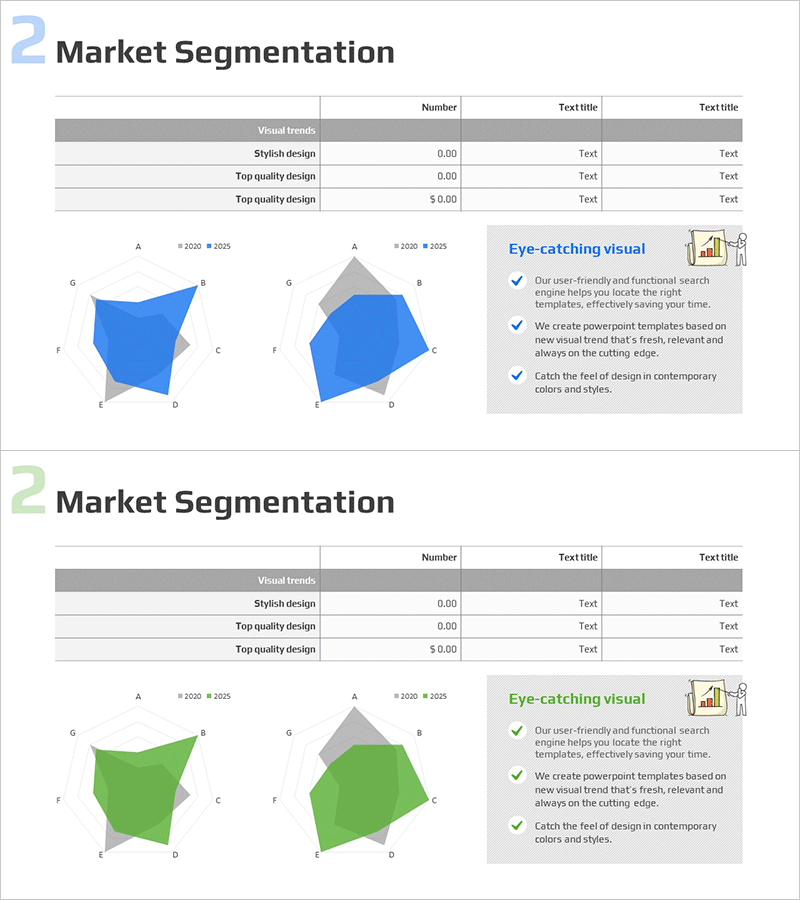
A radial graph PowerPoint slide designed for market segmentation analysis. This presentation template visualizes five market sectors using a radial structure that extends from the center, allowing clear comparison of relative sizes and proportions across segments. The layout overlays 2020 and 2025 data points to highlight temporal changes and market evolution trends. Blue and gray color differentiation distinguishes current from historical data, while accompanying data tables provide detailed numerical context alongside visual summaries. The 2-slide set is ready for immediate use in business presentations, market analysis reports, and investor pitches.
Usage Points
-
Main Usage
Optimized for comparing multiple market sectors simultaneously and emphasizing relative proportions in segmentation analysis. The radial expansion structure intuitively conveys segment scale and changes, while year-over-year comparison clearly illustrates market trend shifts and competitive positioning.
-
How to Use
Use in business presentations, market research reports, investor relations meetings, and strategic planning sessions to explain market segmentation status. Combining numerical tables with visual graphs enhances audience comprehension, while dual-year comparison effectively highlights market evolution and growth trajectories.
-
Recommended For
Marketing managers, business strategists, market research analysts, and executives presenting market segmentation findings. Particularly effective when multi-variable comparison is essential for strategic decision-making and competitive analysis.
-
Slide Structure
Slide 1: Title, descriptive text, two 5-sector radial graphs (2020 blue, 2025 gray), legend indicators. Slide 2: Matching radial graph structure, three eye-catching visual callout boxes with checkmarks, detailed numerical data table. Total 2 slides, 16:9 widescreen format, PPTX.
Related Products
-

Industry Trend Analysis Donut Chart – Visual Trends Presentation
#Market and Competitor Analysis #Diagram #Graph
-

Goal Setting & Radial Graph – Intuitive Data Visualization
#Business Introduction #Market and Competitor Analysis #Diagram
-

Market Analysis Donut Chart & Table Slide
#Market and Competitor Analysis #Diagram #Graph
-

Market Segmentation Diagram by Industry
#Business Introduction #Market and Competitor Analysis #Diagram
