Charge Shape Circle Graph for Visualizing Data Analysis – Effective Market and Competitor Analysis
RJ0700009_25
- Last Update 07/24/2025
- File Size 2.2MB
- # of Slides 2
- File Format PPTX
- Slide Ratio 16:9
- Color
Keywords
- #Content-Based Slides
- #Design-Based Slides
- #Product/Service Introduction
- #Market and Competitor Analysis
- #Graph
- #Other
- #Development Status
- #Market Share
- #Circles
- #Doughnut Chart
- #16:9
- #donut chart PowerPoint slide
- #pie chart template
- #ratio data visualization
- #market analysis chart
- #competitor analysis slide
- #how to create pie chart in PowerPoint
About the Product
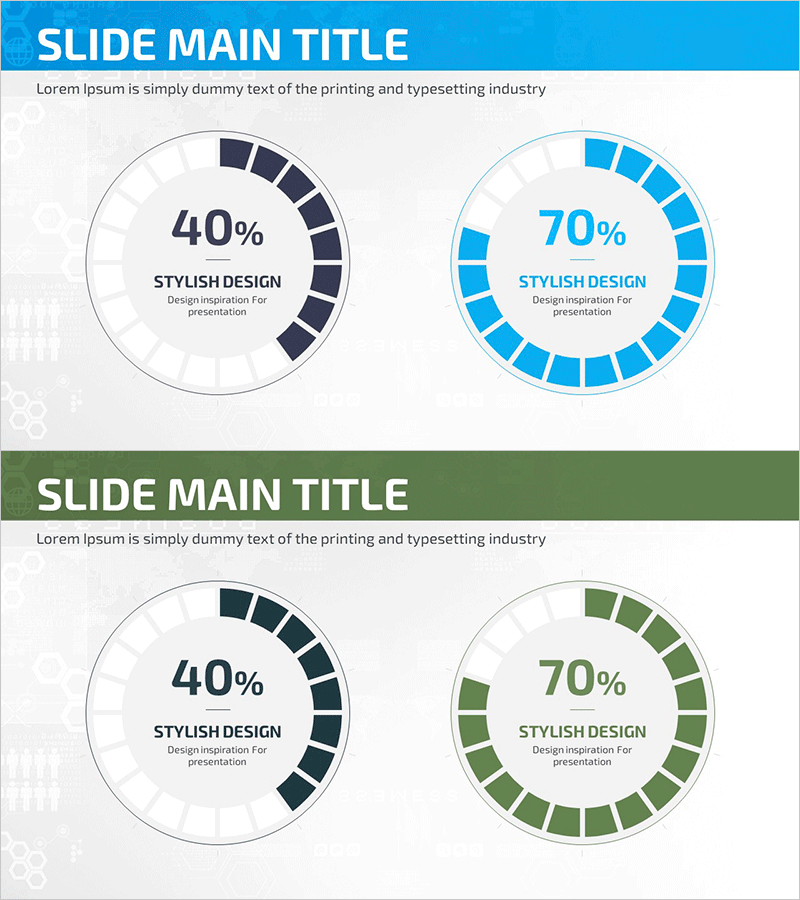
A donut-shaped pie chart PowerPoint slide optimized for market analysis and competitor comparison presentations. This slide deck features two color variations—dark navy and sky blue—displaying 40% and 70% ratio data with clear visual hierarchy. Composed of 2 slides in 16:9 widescreen format, each slide includes percentage values and descriptive labels for immediate use in business presentations and reports. The donut structure allows for additional text or icons in the center, enhancing information delivery.
Usage Points
-
Main Usage
Effectively visualizes two data categories simultaneously, such as market share percentages, competitive positioning, or customer segment distribution. The donut format provides space in the center for supplementary text, icons, or additional data labels.
-
How to Use
Insert into business plans, marketing strategy presentations, quarterly performance reports, and market analysis sections. Edit the percentage values and labels with your own data and place directly into presentation slides without additional design work.
-
Recommended For
Marketing professionals, business strategists, sales managers, consultants, and analysts who need to communicate data-driven insights visually. Ideal for executive briefings, investor presentations, strategic planning meetings, and competitive analysis reports.
-
Slide Structure
2-slide set with one donut chart per slide. Navy-colored chart and sky-blue-colored chart provide distinct visual options for different scenarios or comparative analysis. Center area includes percentage values and label fields for customization.
Related Products
-

Aerospace Industry Progress Status Graph – Analysis and Vision Presentation
#Product/Service Introduction #Market and Competitor Analysis #Graph
-

Donut Chart Slide for Major Cultivation Countries
#Product/Service Introduction #Market and Competitor Analysis #Graph
-

Space Exploration Donut Pie Chart
#Product/Service Introduction #Market and Competitor Analysis #Graph
-

Sales Status Analysis Graph – Simple and Stylish Design
#Product/Service Introduction #Market and Competitor Analysis #Graph
