Donut Chart Slide for Major Cultivation Countries
RJ0600097_27
- Last Update 07/17/2025
- File Size 2.5MB
- # of Slides 2
- File Format PPTX
- Slide Ratio 16:9
- Color
Keywords
- #Content-Based Slides
- #Design-Based Slides
- #Product/Service Introduction
- #Market and Competitor Analysis
- #Graph
- #Other
- #Development Status
- #Market Share
- #Circles
- #Doughnut Chart
- #16:9
- #donut chart PowerPoint slide
- #pie chart presentation template
- #market share visualization
- #regional data comparison
- #percentage chart PPT download
About the Product
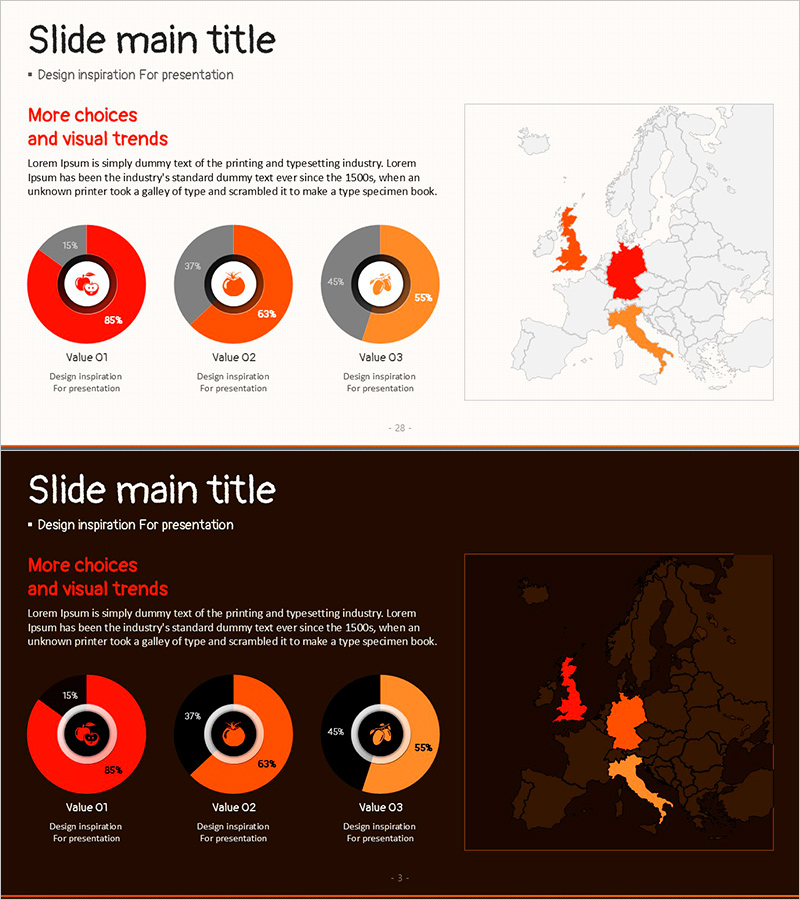
A PowerPoint slide featuring three donut charts visualizing market share by major cultivation countries. Each chart uses red and orange gradient tones to represent percentage data clearly, while the accompanying Europe map on the right highlights corresponding regions for instant geographic context. This presentation slide effectively communicates market share, sales distribution, and customer concentration across regions in product and service introductions. Two slide layouts are provided—light background and dark background versions—allowing you to select the design that best matches your presentation environment.
Usage Points
-
Main Usage
Display and compare three sets of percentage data—such as regional market share, sales distribution, and customer concentration—simultaneously. The donut chart centers clearly show percentage values, while the integrated map visualization reinforces geographic context and regional performance.
-
How to Use
Use in product introductions, market analysis presentations, sales reports, and investor pitch decks when presenting regional performance data. Edit the percentage values and colors in each donut chart to match your actual data, and modify the map highlights to emphasize target markets or regions.
-
Recommended For
Marketing and sales teams presenting regional market share reports, product planning teams explaining geographic sales strategies, executive presentations of quarterly regional performance, and investor presentations of global market conditions. Particularly valuable for international business, agricultural and food industries, and retail distribution companies analyzing regional markets.
-
Slide Structure
Slide 1 (light background): Title area + 3 donut charts (Value Q1, Q2, Q3 with 2-3 data series each) + Europe map with red and orange highlights. Slide 2 (dark background): Identical layout with dark theme. Each donut chart includes center percentage display, legend, and text annotation areas for customization.
Related Products
-

Aerospace Industry Progress Status Graph – Analysis and Vision Presentation
#Product/Service Introduction #Market and Competitor Analysis #Graph
-

Charge Shape Circle Graph for Visualizing Data Analysis – Effective Market and Competitor Analysis
#Product/Service Introduction #Market and Competitor Analysis #Graph
-

Space Exploration Donut Pie Chart
#Product/Service Introduction #Market and Competitor Analysis #Graph
-

Sales Status Analysis Graph – Simple and Stylish Design
#Product/Service Introduction #Market and Competitor Analysis #Graph
