Market Share and Usage Status by Application – Statistical Analysis
RJ0400038_6
- Last Update 05/27/2025
- File Size 5MB
- # of Slides 2
- File Format PPTX
- Slide Ratio 16:9
- Color
Keywords
- #Content-Based Slides
- #Design-Based Slides
- #Market and Competitor Analysis
- #Graph
- #Other
- #Market Status
- #Market Share
- #Circles
- #Doughnut Chart
- #Mockup
- #16:9
- #smartphone mockup PowerPoint
- #donut chart slide template
- #mobile app market analysis PPT
- #data visualization slides
- #3-series chart template
- #pie chart PowerPoint download
About the Product
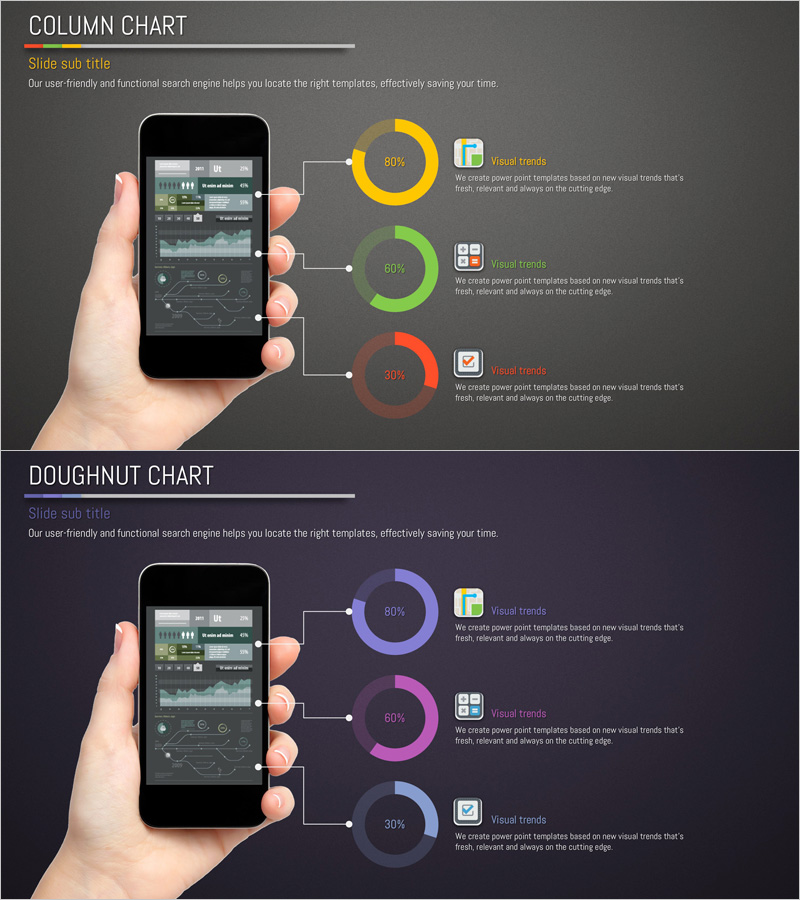
A professional PowerPoint slide combining a smartphone mockup held in hand with three donut charts for multi-series data comparison. The design uses distinct color coding—yellow, green, and red on the first slide; purple, pink, and blue on the second—to represent different data categories. Connection lines and icons guide viewers through mobile app market share, usage patterns, and statistical analysis. Optimized for 16:9 widescreen format with 2-slide layout, ready for presentations, reports, and business proposals. All elements including charts, text, and colors are fully editable to match your data and branding.
Usage Points
-
Main Usage
Designed to present mobile app market share, user distribution, and usage statistics with visual clarity. The smartphone mockup reinforces real-world context, making it ideal for mobile-focused presentations that require both credibility and practical relevance.
-
How to Use
Insert this slide into marketing reports, business analysis presentations, or product strategy decks in the market analysis section. Replace chart percentages and labels with your actual data, and adjust colors to match your corporate branding if needed. Keep the smartphone image fixed while updating only the chart data for quick reuse across multiple presentations.
-
Recommended For
Marketing teams, market researchers, product managers, and executives in IT, telecommunications, and mobile services industries. Perfect for presenting app download trends, platform-specific user ratios, mobile adoption rates, and competitive market positioning.
-
Slide Structure
Slide 1: Column chart section featuring smartphone mockup (left) with three donut charts in yellow, green, and red (right), plus icons and text labels. Slide 2: Identical layout with three donut charts in purple, pink, and blue. All charts support percentage display and are color-coded by data series for clear comparison.
Related Products
-

Distribution Graph of Food Materials – Market Status Chart
#Market and Competitor Analysis #Graph #Other
-

Eco-friendly Donut Graph Analysis – Insights on Market Trends
#Market and Competitor Analysis #Graph #Market Status
-

Furniture Donut Charts – Market Share Analysis
#Market and Competitor Analysis #Graph #Market Status
-

Donut Chart: Feature Usage Ratio in Mobile Banking
#Market and Competitor Analysis #Diagram #Graph
