Aerospace Industry Progress Status Graph – Analysis and Vision Presentation
RJ0700006_27
- Last Update 07/23/2025
- File Size 1.8MB
- # of Slides 2
- File Format PPTX
- Slide Ratio 16:9
- Color
Keywords
- #Content-Based Slides
- #Design-Based Slides
- #Product/Service Introduction
- #Market and Competitor Analysis
- #Graph
- #Other
- #Development Status
- #Market Share
- #Circles
- #Doughnut Chart
- #16:9
- #donut chart PowerPoint slide
- #donut pie chart template
- #ratio comparison graph
- #how to create donut chart in PowerPoint
- #aerospace industry presentation template
About the Product
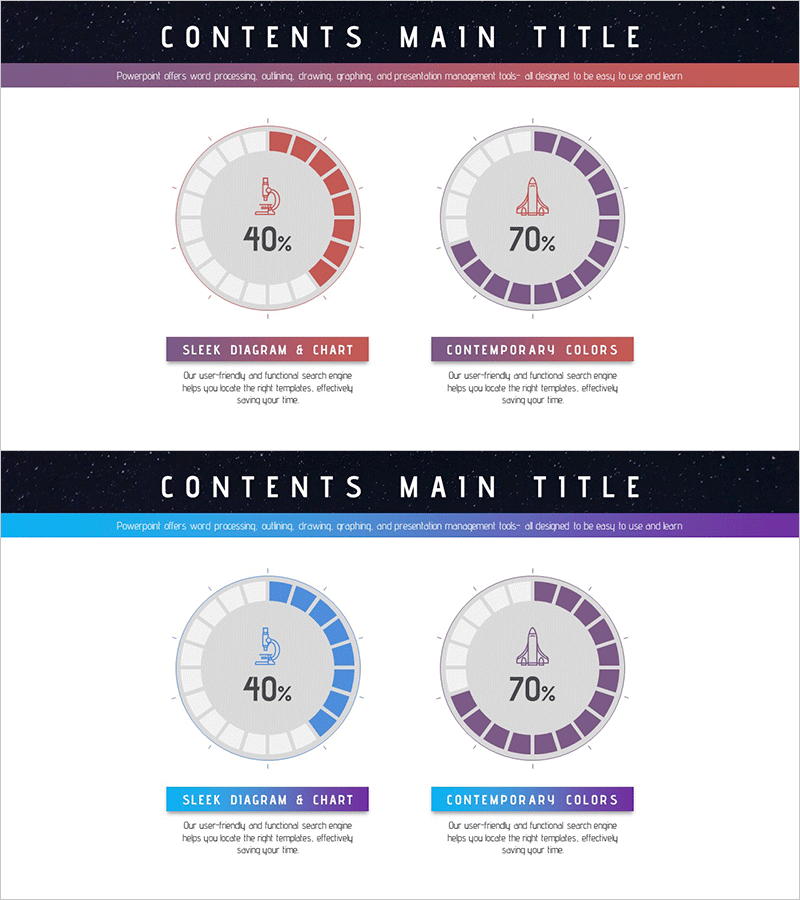
A donut chart PowerPoint slide template designed to visualize aerospace industry progress status and comparative data analysis. Two donut-shaped pie charts with centered icons and percentages (40%, 70%) clearly represent business metrics and performance indicators. The red and purple dual-tone color scheme contrasts against a gray background to emphasize data segments, while descriptive text areas below each chart enable immediate use in professional presentations. This 2-slide deck supports editing for competitive analysis, vision statements, progress reports, and various business scenarios.
Usage Points
-
Main Usage
Visualize industry progress, goal achievement rates, and comparative ratio data using donut-shaped pie charts for executive reports, business analysis presentations, and strategic vision materials. Centered icons and percentage values enable instant comprehension of key performance indicators.
-
How to Use
Replace the donut chart percentages (40%, 70%) and icons with your own data, then edit the descriptive text labels to match your presentation context. Maintain the red and purple color scheme or customize with corporate brand colors for consistent visual identity throughout the deck.
-
Recommended For
Aerospace, defense, manufacturing, and energy sector professionals presenting project progress reports to executives. Ideal for industry analysis reports, competitive benchmarking materials, quarterly and annual performance reviews, and strategic business presentations.
-
Slide Structure
Two-slide layout featuring two donut-shaped pie charts (12-segment divisions) positioned side-by-side on each slide. Each chart includes a centered icon with percentage text and a descriptive label below. Slide 1 uses red-tone coloring while Slide 2 features purple-tone variation for design flexibility.
Related Products
-

Space Exploration Donut Pie Chart
#Product/Service Introduction #Market and Competitor Analysis #Graph
-

Donut Chart Slide for Major Cultivation Countries
#Product/Service Introduction #Market and Competitor Analysis #Graph
-

Charge Shape Circle Graph for Visualizing Data Analysis – Effective Market and Competitor Analysis
#Product/Service Introduction #Market and Competitor Analysis #Graph
-

Analyzing ABC District Occupancy with Doughnut Chart
#Market and Competitor Analysis #Graph #Other
