Banking Services Layer Diagram – Business Strategy
RJ0300081_7
- Last Update 05/12/2025
- File Size 0.8MB
- # of Slides 2
- File Format PPTX
- Slide Ratio 16:9
- Color
Keywords
- #Content-Based Slides
- #Design-Based Slides
- #Business Strategy
- #Operational Plan
- #Diagram
- #Graph
- #Step-by-Step Schedule Plan
- #Business Processes
- #Structure
- #Circles
- #Pyramid Chart
- #Pie Chart
- #16:9
- #radial diagram PowerPoint slide
- #pie chart presentation template
- #4-step business strategy diagram
- #business plan PPT download
- #financial services presentation slide
About the Product
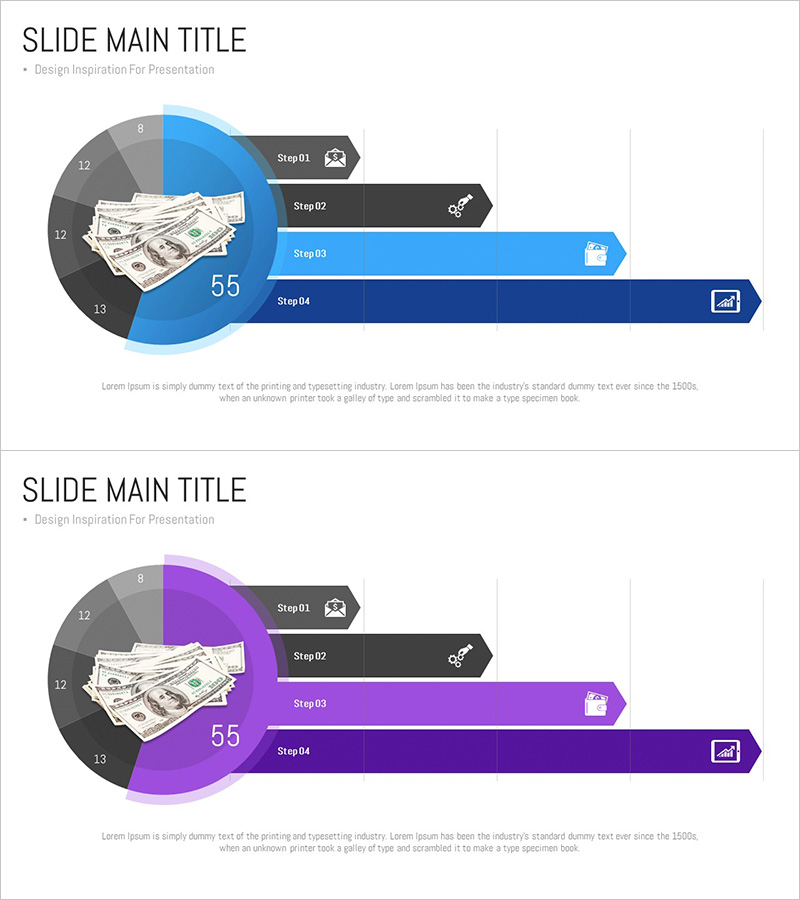
A professional PowerPoint slide combining a pie chart with a 4-step radial diagram for business strategy presentations. The left side features a circular pie chart visualizing proportional data with percentage segments, while the right side displays four arrow-shaped step boxes (Step01–Step04) with icons for sequential strategy explanation. The design uses blue and purple gradient tones to create visual hierarchy and depth. Each step includes an icon to enhance information clarity. This slide template is ready to use for financial services presentations, business planning, marketing strategy rollouts, organizational planning, and corporate communications in banking, insurance, and service industries.
Usage Points
-
Main Usage
Visualize proportional data with a pie chart on the left while explaining a 4-step business strategy using a radial diagram on the right. Ideal for financial institutions, service companies, and corporate teams presenting quarterly business plans, new service launches, organizational changes, and investor relations materials.
-
How to Use
Input your actual data into the pie chart segments on the left side. Add strategy details, objectives, and action items to the four step boxes on the right. Customize the icons for each step to match your organization's branding, and adjust the color scheme to align with your corporate identity for a polished presentation.
-
Recommended For
Finance and banking professionals, marketing and strategy managers, business development executives, consultants, and C-suite presenters. Use for quarterly business reviews, service launch strategies, organizational restructuring announcements, investor pitch decks, and strategic planning sessions.
-
Slide Structure
2-slide template with identical layout. Each slide features a left-aligned pie chart (4 segments with center percentage display) and right-aligned 4-step arrow boxes (Step01–Step04, each with icon). Blue-purple-dark gray gradient color scheme applied throughout. 16:9 widescreen format, fully editable PPTX.
Related Products
-

Joint Business Development Phase Slide – Effective Operating Plan
#Business Strategy #Operational Plan #Diagram
-

Service Business Process Diagram – Efficient Business Advancement
#Business Strategy #Operational Plan #Diagram
-

Business Process Diagram – Optimizing Workflow
#Business Strategy #Operational Plan #Diagram
-

Pencil Step Diagram – Business Strategy and Operational Planning
#Business Strategy #Operational Plan #Step-by-Step Schedule Plan
