Step by Step Silhouette Graph – Visualization for Operational Planning
RJ0400019_14
- Last Update 05/22/2025
- File Size 0.4MB
- # of Slides 2
- File Format PPTX
- Slide Ratio 16:9
- Color
Keywords
- #Content-Based Slides
- #Design-Based Slides
- #Business Management
- #Operational Plan
- #Graph
- #Other
- #Implementation Plan
- #Business Processes
- #Silhouette
- #16:9
- #step by step silhouette graph PowerPoint
- #process visualization slide
- #5-stage progression PPT
- #operational planning infographic
- #how to show process flow in PowerPoint
About the Product
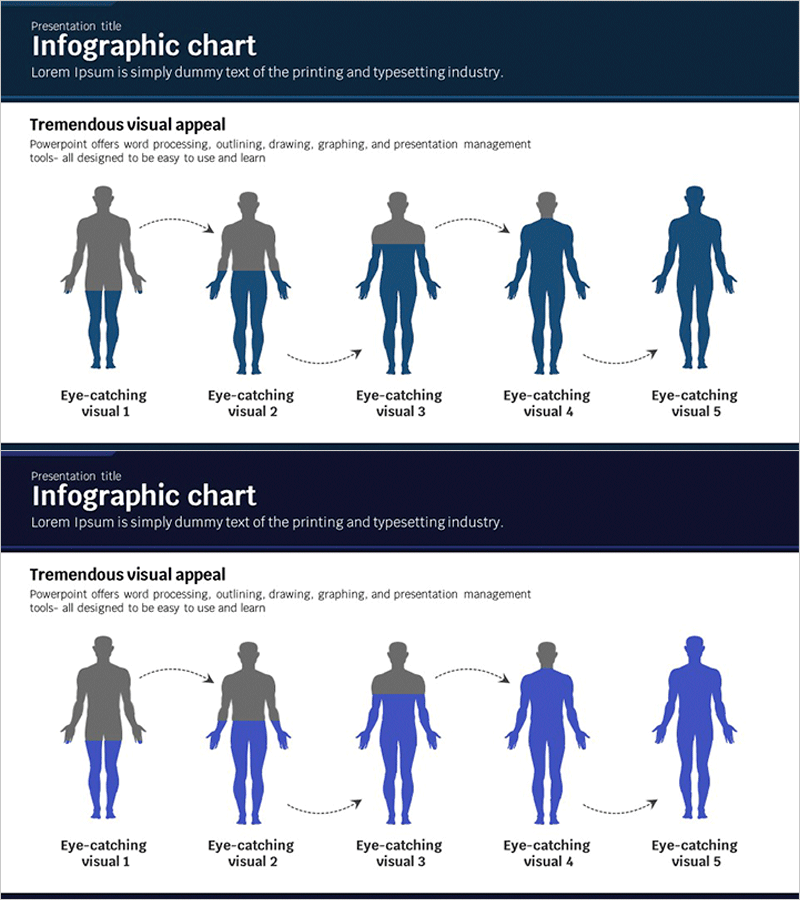
A PowerPoint slide that visualizes a 5-stage progression process using human silhouette figures. Set against a dark navy background with gray and blue-toned silhouettes connected by dotted arrows, this design effectively communicates sequential workflows, operational planning, and change management. The 2-slide set offers multiple color variations—gray-to-blue gradient and full blue tone—allowing you to select the best match for your presentation context. Ample text input areas below each silhouette enable detailed stage descriptions, and the layout is optimized for 16:9 widescreen displays.
Usage Points
-
Main Usage
Designed to visually explain business progression stages, operational planning, and process workflows. Human silhouettes transform abstract concepts into concrete, easy-to-understand visuals that capture audience attention and improve comprehension.
-
How to Use
Enter stage names, timelines, objectives, or responsible parties in the text areas below each silhouette. Dotted arrows represent time progression or sequential flow, making this layout suitable for any left-to-right process explanation. Customize color tones to match your presentation theme and content.
-
Recommended For
Ideal for business plans, operational reports, change management presentations, project status updates, organizational restructuring explanations, and strategic execution roadmaps. Recommended for executives, team leaders, and project managers presenting stage-by-stage progress.
-
Slide Structure
2-slide set with Slide 1 featuring gray-to-blue gradient tones and Slide 2 in full blue. Each slide contains 5 human silhouettes connected by dotted arrows, text input areas below each figure, and a header section for titles and descriptions. Fully editable and ready for immediate customization.
Related Products
-

Propeller Plan Slides with Silhouettes
#Business Management #Operational Plan #Other
-

Business Process Arrow Diagram – Systematic Business Management
#Business Management #Operational Plan #Diagram
-

Triangle Pattern Template with Hexagon Pie Chart
#Product/Service Introduction #Business Management #Diagram
-

Challenge and Winning Diagrams for Process Decision Making
#Business Management #Operational Plan #Diagram
