Competitor Progress Comparison Analysis Graph – Essential Tool for Market Analysis
RJ0400051_8
- Last Update 05/31/2025
- File Size 4.7MB
- # of Slides 2
- File Format PPTX
- Slide Ratio 16:9
- Color
Keywords
- #Content-Based Slides
- #Design-Based Slides
- #Market and Competitor Analysis
- #Graph
- #Competitor Analysis
- #Competitive Advantage
- #Circles
- #Line
- #Doughnut Chart
- #Line Chart
- #16:9
- #line chart PowerPoint slide
- #dual-series trend comparison
- #market analysis chart
- #competitor analysis graph
- #how to create line chart in PowerPoint
About the Product
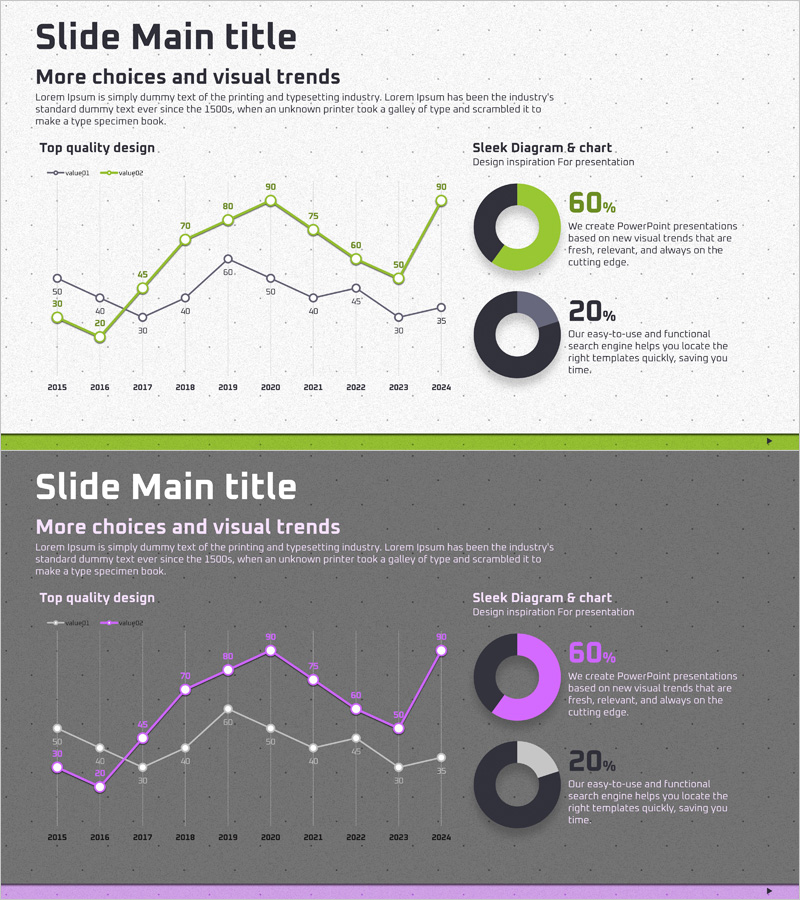
A PowerPoint slide featuring a dual-series line chart that visualizes competitor progress and market trends from 2015 to 2024. The chart uses lime green and charcoal tones to clearly distinguish between two data series, with precise numerical labels at each data point for accurate value comparison. The grid background enhances readability and supports quick data interpretation. This presentation slide is ready to use for market analysis, competitive benchmarking, performance tracking, and business trend reports where trend visualization is essential.
Usage Points
-
Main Usage
This slide visualizes long-term trend data across two series over a 10-year period. It is ideal for comparative analysis scenarios such as competitor performance vs. company performance, or market average vs. individual company results. Numerical labels on each data point ensure precise data communication and clear trend differentiation.
-
How to Use
Use this slide in the market analysis section to explain competitive landscape changes, or in business performance reports to present year-over-year trends. The contrasting lime green and charcoal color scheme makes the two data series immediately distinguishable, allowing audiences to grasp trend differences at a glance. Simply edit the data values with your own figures for immediate use.
-
Recommended For
Ideal for marketing strategy presentations, business performance reports, investor pitch decks, and executive briefings. Particularly valuable for market researchers, strategic planners, sales managers, financial analysts, and other professionals who rely on data-driven decision-making.
-
Slide Structure
Dual-series line chart with X-axis showing years 2015–2024 (10 data points) and Y-axis ranging from 0 to 90. Each data point displays precise numerical values, and a grid background enhances readability. Two donut charts (60% and 20%) are positioned on the right side for additional information emphasis.
Related Products
-

Competitive Advantage Analysis Graph – Market and Competitor Analysis
#Market and Competitor Analysis #Graph #Competitor Analysis
-

Gradient Theme Broken Line Graph – Market Analysis and Competitive Edge
#Market and Competitor Analysis #Graph #Competitor Analysis
-

Competitor Analysis Trend Graph – Data-Driven Insights
#Market and Competitor Analysis #Graph #Competitor Analysis
-

Sleek Graphs and Charts – Visual Data Communication
#Market and Competitor Analysis #Graph #Competitor Analysis
