Car Wide Template Line Chart 2 – Market Analysis and Competitor Comparison
RJ0200044_23
- Last Update 04/10/2025
- File Size 2.8MB
- # of Slides 2
- File Format PPTX
- Slide Ratio 16:9
- Color
Keywords
- #Content-Based Slides
- #Design-Based Slides
- #Market and Competitor Analysis
- #Diagram
- #Graph
- #Competitor Analysis
- #Market Analysis
- #Line
- #Line Chart
- #16:9
- #line chart PowerPoint
- #multi-series trend slide
- #data visualization PPT
- #competitor analysis chart
- #market analysis presentation
- #PowerPoint slide template download
About the Product
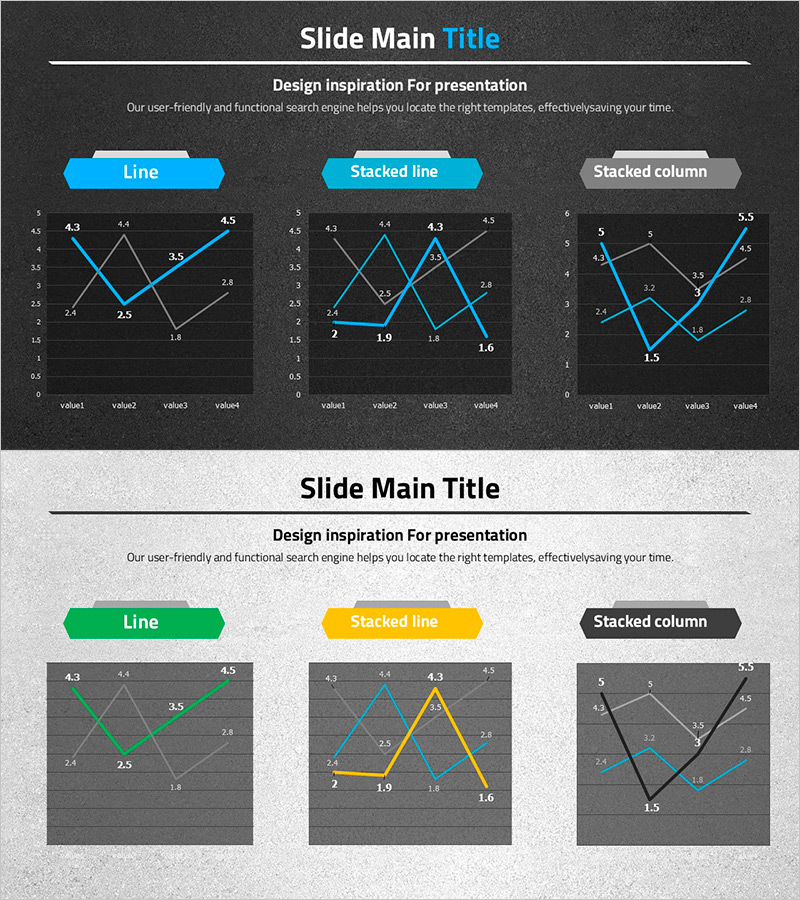
A multi-series line chart PowerPoint slide designed for market analysis and competitor comparison presentations. The slide features three data series (blue, gray, and black lines) on a dark background, visualizing trend changes across multiple metrics simultaneously. Each slide includes three chart variations: standard line chart, stacked line chart, and stacked column chart, all based on four data points to clearly represent numerical fluctuations. This presentation template is ready for immediate use in business reports, performance reviews, and analytical decks.
Usage Points
-
Main Usage
Visualize and compare multiple data series such as market trends, competitor performance, and sales metrics simultaneously. The slide offers three chart formats—standard line, stacked line, and stacked column—to accommodate different data structures, with four data points clearly showing numerical changes and trends.
-
How to Use
Use in business reports, marketing presentations, investor pitches, and quarterly reviews to compare period-over-period performance, benchmark competitors, and illustrate market share evolution. The dark professional background suits executive briefings, client presentations, and academic conferences.
-
Recommended For
Finance professionals, marketing managers, business analysts, data scientists, and consultants who need to present data-driven insights. Ideal for quarterly performance reports, market analysis presentations, competitive strategy meetings, and investor communications.
-
Slide Structure
Two-slide set: First slide displays a single-series line chart (blue accent) alongside a multi-series stacked line chart in side-by-side layout. Second slide presents the same data as a stacked column chart. Each chart includes four data points (value1–value4) with Y-axis range 0–5.5, optimized for 16:9 widescreen format.
Related Products
-

Competitor Market Analysis Table – Strategic Insights
#Market and Competitor Analysis #Diagram #Graph
-

Graph Chart for Analysis Comparison – Market and Competitor Analysis
#Market and Competitor Analysis #Diagram #Graph
-

Black Navy Broken Line Graph Table – Market and Competitor Analysis
#Market and Competitor Analysis #Diagram #Graph
-

Sales and Profit Analysis Graph – Market Trends and Forecast
#Market and Competitor Analysis #Diagram #Graph
