Infinite Energy Wide PPT Vertical Bar Chart
RJ0200051_4
- Last Update 04/13/2025
- File Size 0.3MB
- # of Slides 2
- File Format PPTX
- Slide Ratio 16:9
- Color
Keywords
About the Product
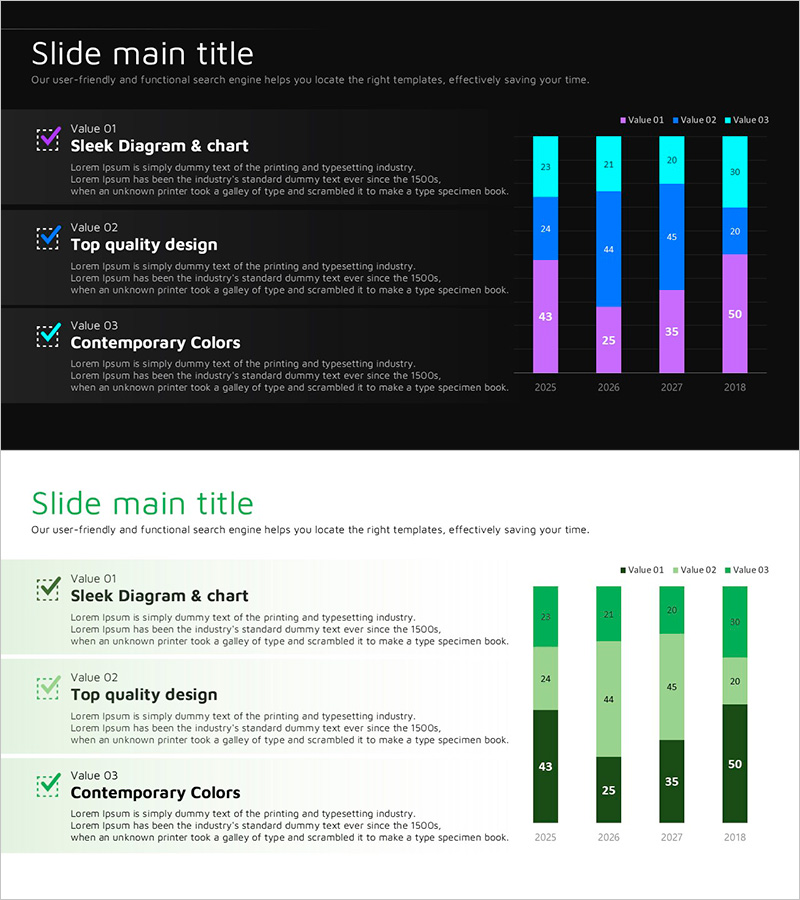
A vertical bar chart PowerPoint slide designed to compare four-series data across multiple years. The bars are color-coded in cyan, blue, purple, and green to distinguish each data series from 2025 to 2028, providing clear visual representation of performance trends. The high contrast between the dark background and bright bar colors ensures excellent readability on presentation screens. Ideal for visualizing business performance, revenue figures, market share, or any quantitative metrics. The template includes two design variations—dark theme and light theme—allowing you to choose the best fit for your presentation environment.
Usage Points
-
Main Usage
Visualize and compare multiple data series across time periods, regions, or categories using a vertical bar chart format. Commonly used for business performance reporting, revenue analysis, market share comparison, budget allocation tracking, and quarterly results presentations.
-
How to Use
Double-click the bar values to edit them with your actual data. Update the legend labels (Value 01, 02, 03) to match your data series names, and modify the X-axis labels to reflect years, quarters, or categories. Colors can be customized to match your corporate branding guidelines.
-
Recommended For
Finance, sales, marketing, and strategy teams presenting to executives. Suitable for quarterly performance reviews, investor presentations, board meetings, business planning sessions, and external stakeholder communications requiring multi-series data comparison.
-
Slide Structure
Two-slide template featuring a 4-series vertical bar chart. Each slide displays data across four years (2025–2028) with color-coded bars, legend, and numerical labels. One slide features a dark background theme, while the other uses a light background, providing flexibility for different presentation contexts.
Related Products
-

Fantastic Wide Diagram – Organizational Chart and Past Achievements
#Company Introduction #Diagram #Graph
-

Vertical Bar Segmentation Graph – Business Performance and Revenue Outlook
#Company Introduction #Business Strategy #Graph
-

Internet Business Analysis Graph - Powerful Data Visualization
#Company Introduction #Business Strategy #Graph
-

Car PowerPoint Template Wide Template Gauge – Performance and Trends
#Company Introduction #Product/Service Introduction #Graph
