Area Graph – Effective Visualization for Market and Competitor Analysis
RJ0300076_26
- Last Update 05/10/2025
- File Size 0.5MB
- # of Slides 2
- File Format PPTX
- Slide Ratio 16:9
- Color
Keywords
About the Product
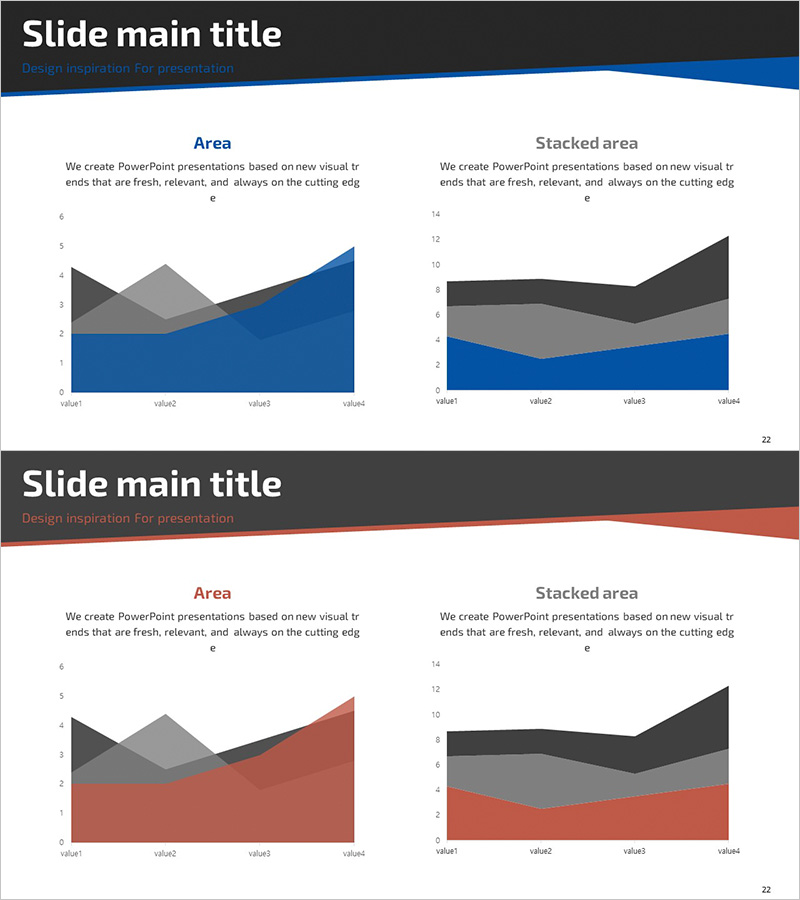
A 2-slide PowerPoint presentation featuring area charts optimized for market analysis and competitive comparison. Available in two color versions—blue and red tones—each slide includes both standard area chart and stacked area chart layouts. The structure accommodates four data points, enabling intuitive visualization of trends over time or market share shifts across multiple competitors. Delivered in 16:9 widescreen PPTX format, fully editable and ready for immediate use in presentations and business reports.
Usage Points
-
Main Usage
Designed to compare market trends and competitor performance over time. The stacked area structure reveals total market size alongside individual competitor share evolution, making it ideal for investor presentations and executive briefings where market positioning shifts must be communicated persuasively.
-
How to Use
Enter analysis period and competitor names in the text fields, then update chart data with actual figures. Select blue tone for trustworthy corporate analysis or red tone to emphasize market risks and urgency. Both layouts support seamless data replacement without design disruption.
-
Recommended For
Strategy planning, marketing, and business development teams preparing market analysis reports and executive presentations. Particularly effective in investment pitch decks where market opportunity and competitive advantage require clear visual evidence.
-
Slide Structure
Two slides, each containing one title area, one subtitle area, one descriptive text field, and two area charts (standard and stacked). Charts support four data series and four X-axis values, enabling flexible scenario mapping for diverse competitive and temporal comparisons.
Related Products
-

Mobile App Competitor Analysis – Visualizing Market Share
#Market and Competitor Analysis #Graph #Other
-

Goal Achievement Analysis Area Graph – Data-driven Competitive Edge
#Market and Competitor Analysis #Graph #Other
-

Competitive Comparison Area Diagram – Visualizing Market Advantage
#Market and Competitor Analysis #Graph #Other
-

Korea China Japan Analysis Graph – Market Competitive Advantage
#Market and Competitor Analysis #Graph #Other
