Real Estate Sales and Consumer Analysis Slide
RJ0900002_7
- Last Update 08/16/2025
- File Size 1MB
- # of Slides 2
- File Format PPTX
- Slide Ratio 16:9
- Color
Keywords
- #Content-Based Slides
- #Design-Based Slides
- #Market and Competitor Analysis
- #Graph
- #Market Status
- #Customer Analysis
- #Column
- #Column Chart
- #16:9
- #real estate bar chart PowerPoint
- #market analysis slide template
- #customer segmentation chart
- #real estate sales presentation
- #data comparison graph PowerPoint
About the Product
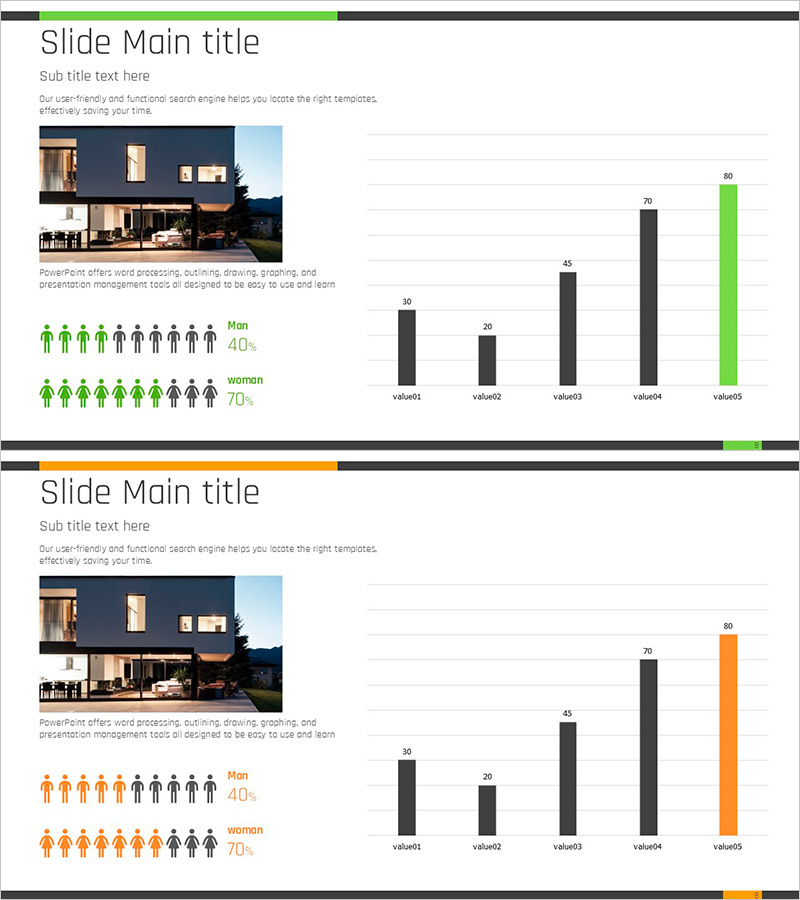
A 2-slide PowerPoint presentation designed for real estate sales and consumer analysis. This slide deck combines vertical and horizontal bar charts to visualize market trends and customer demographics with clarity. The color scheme uses green, orange, and black accents to highlight key data points, while gender distribution icons provide intuitive customer segmentation visualization. Perfect for real estate sales presentations, market research reports, and customer analysis materials that require immediate deployment.
Usage Points
-
Main Usage
Effectively communicate market conditions and customer segmentation data in real estate sales and marketing presentations. The combination of vertical and horizontal bar charts supports multiple comparison scenarios, while gender distribution icons emphasize target audience analysis and demographic insights.
-
How to Use
Slide 1 displays a vertical bar chart comparing 5 data values (value01 through value05, ranging 30–80). Slide 2 shows a horizontal bar chart paired with customer demographic icons indicating male (40%) and female (70%) distribution. Edit the chart values and labels to input your actual sales data or market research findings.
-
Recommended For
Ideal for real estate agencies, construction companies, and residential sales teams presenting quarterly performance, market analysis reports, customer targeting strategies, and sales forecasts. Recommended for marketing managers, sales directors, and market research professionals supporting data-driven decision-making.
-
Slide Structure
2-slide layout in 16:9 widescreen format. Slide 1: vertical bar chart with 5 items (value01–value05, 30–80 range). Slide 2: horizontal bar chart with gender demographic icons (male 40%, female 70%). Title, subtitle, image, and chart areas are balanced across both slides.
Related Products
-

Consumer Insights & Behavioral Patterns Analysis Slide
#Market and Competitor Analysis #Graph #Market Status
-

Smoking Cessation Survey Slide – Market Analysis and Statistics
#Market and Competitor Analysis #Graph #Market Status
-

Customer Type Analysis Bar Graph – Data Visualization for Customer Success
#Company Introduction #Market and Competitor Analysis #Customer Success Stories
-

Business Trends and Market Status Visualization Slide Template – Ideal for Insights and Analysis
#Business Introduction #Market and Competitor Analysis #Graph
